

BCM UPDATES
We’re fast approaching that most wonderful time of the year, the Holiday season. It is a time to give thanks and to appreciate our blessings. At BCM that always includes recognizing our clients, families, and friends who invest their trust and confidence in us everyday. It is both a privilege and honor to serve you, and we do not take that duty lightly. We thank you from the bottom of our hearts!
This year, additional gratitude is needed for our newest team member, Charles Tracy (Chuck). Chuck joined BCM earlier this year as managing director after more than a decade in financial services and fin-tech. During that time Chuck also earned a CFA charter and an MBA from the Anderson School of Business at UCLA. Chuck is smart, talented, and brings valuable knowledge, experience, and ideas to the team.
We look forward to sharing some of those ideas with you in the months ahead. Meanwhile, we’re thrilled to have Chuck on board, and we continue to count our blessings
ECONOMIC VIEW
The violent whipsaw in oil prices has left many people dazed and confused about economic conditions. Brent crude swung between $60 to over $120/barrel between Q1 to Q3. We saw a short reprieve in Q3, but prices are back above $100/barrel as tensions flare with Iran once again.
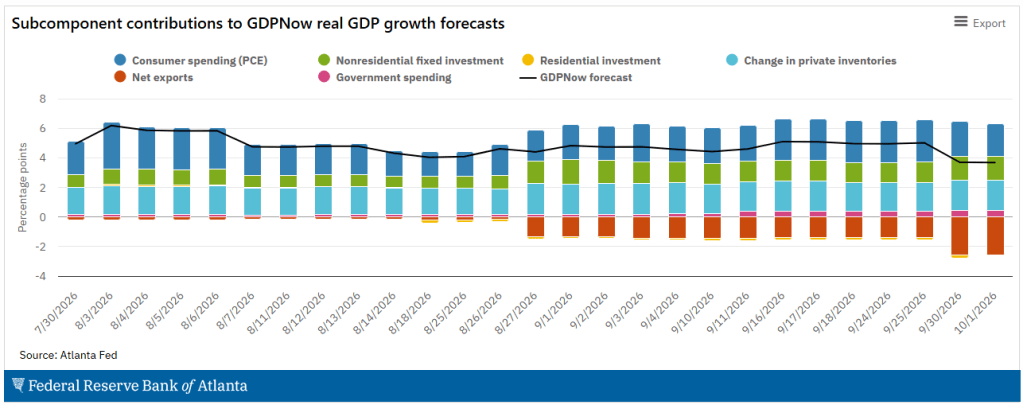
Despite that, markets and politicians appear optimistic that the price spike will be temporary. Oil shocks aside, the U.S. economy appears squarely in expansion territory. The most recent Atlanta Fed’s GDPNow indicator shows annualized real economic growth of +3.7% for Q3.
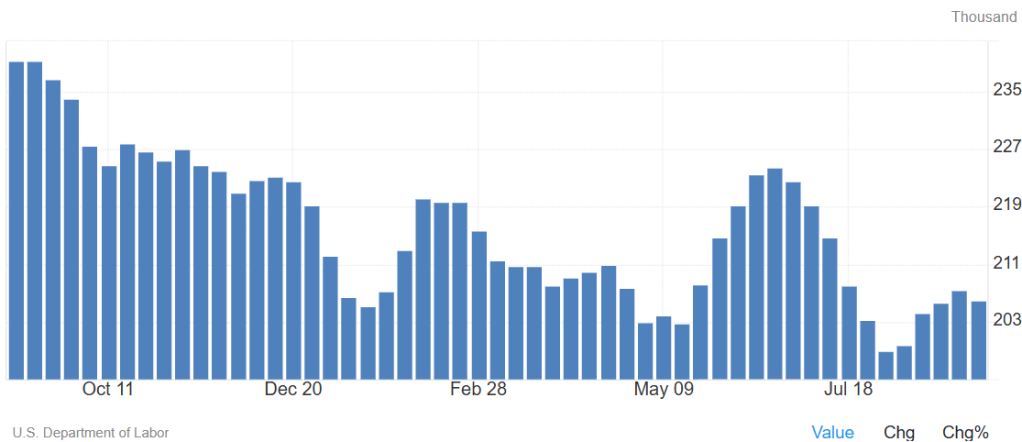
Meanwhile, the employment market continues to show resilience. Despite a scare in Q2, Jobless Claims have continued an overall down trend over the past year.
Initial Jobless Claims (4 Week Average)
One economic concern that is all over the headlines is the rise in interest rates. The yield on the the benchmark 10 Year Treasury note has climbed over the past year and is at the highest levels in two decades. Markets generally don’t like rising interest rates, as they can be drag on earnings, valuations, and other things. That has some investors expecting the worst.
10 Year Treasury Yields (Past Year)
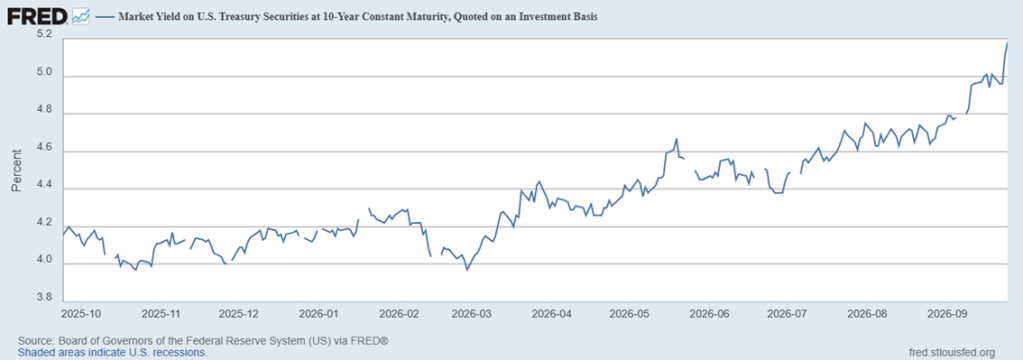
Anything is possible with markets, however I doubt this rise in yields is the onset of a worst case scenario. For one thing, 5.30% on the 10 Year Treasury is no where near catastrophic. In addition, 5% is still well below the long-term average level of around 7%. The real anomaly has been been abnormally low yields over the past two decades. Let’s remember the 10 Year Treasury hit an unbelievable 0.3% during COVID!
10 Year Treasury Yields (Since 1960)
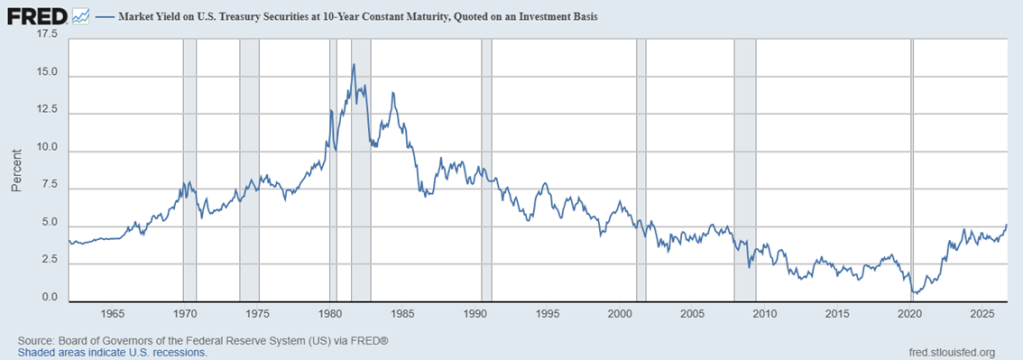
Yes, a sustained and dramatic rise in yields from here could spell catastrophe, but we’re simply not at that point now and it seems premature to cry wolf. Rising yields are worth keeping an eye on, but they are not the death knell some are fearing, and economic conditions continue to look benign overall.
MARKET VIEW
After a rough start to the year, global equity markets continued to make progress through Q3. Global stock market prices advanced +12% year to date. Emerging markets took the lead, up +19%. Meanwhile, US bond prices and gold were both down, declining -5% and -4%, respectively.
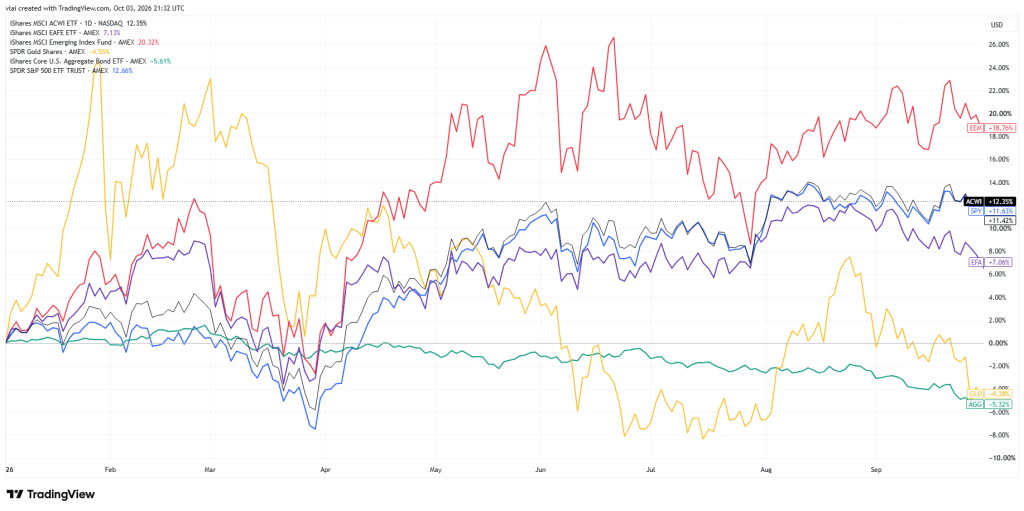
Our decision to “re-risk” Macro Allocation portfolios in Q2 worked favorably as equity markets made progress through Q3. As the all time highs in stock prices climb ever-higher, investors can’t help but whisper about similarities in price action seen during the Dot Com bubble.
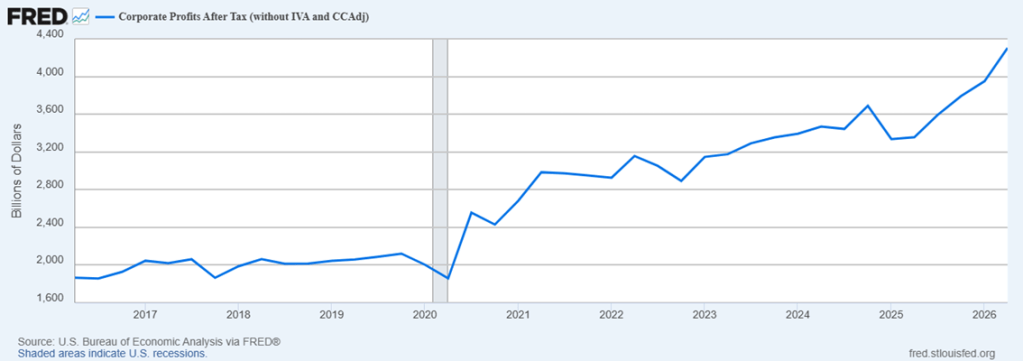
Similarities do exist, but one important distinction is earnings, or lack thereof. Currently, corporate earnings, as with stock prices, are hitting all time highs. Analysts have needed to revise their expectations upwards just to keep up.
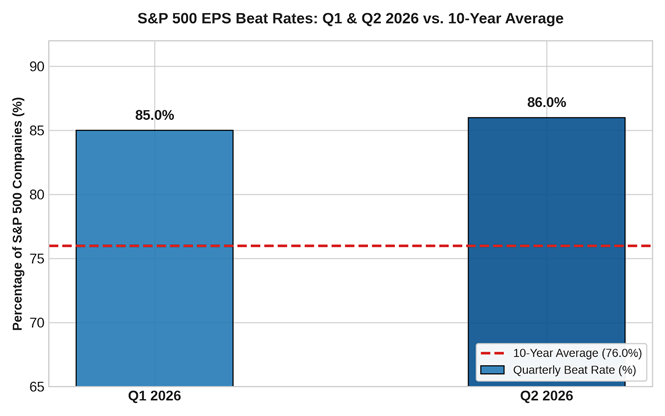
Not only are earnings growing, but earnings per share are also growing faster than even those revised expectations mentioned above. 86% of S&P 500 companies beat consensus analyst estimates in Q2 2026 (versus 76% long-term).
That’s a crucial distinction from the Dot Com bubble when parabolic price rises shot up without any earnings beneath them. That doesn’t mean current prices aren’t high, or that the market isn’t in a bubble. However, it does mean that current market prices have more fundamental support than they did in 2000.
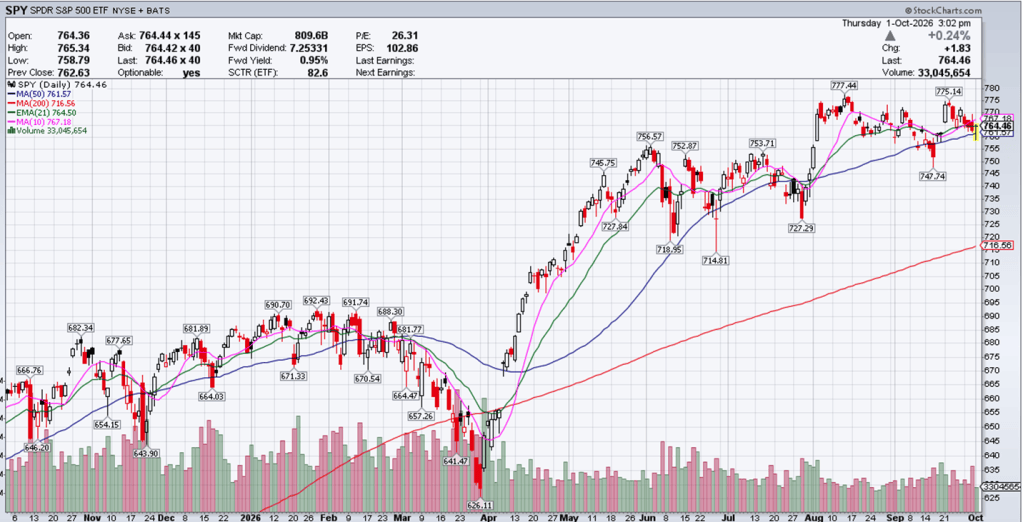
From a technical perspective, the US equity market also looks constructive at an aggregate level. The S&P 500 continues to respect it’s intermediate and long-term trends, with steady volume, shown in the chart below (SPY).
S&P 500
However, a closer look at technicals reveals that market strength is not as broad or strong as headlines indicate. The chart below shows the S&P 500 equal weighted index (RSP), which removes the influence of market capitalization, and the inflated effect that the largest stocks have on the index.
S&P 500 Equal Weight
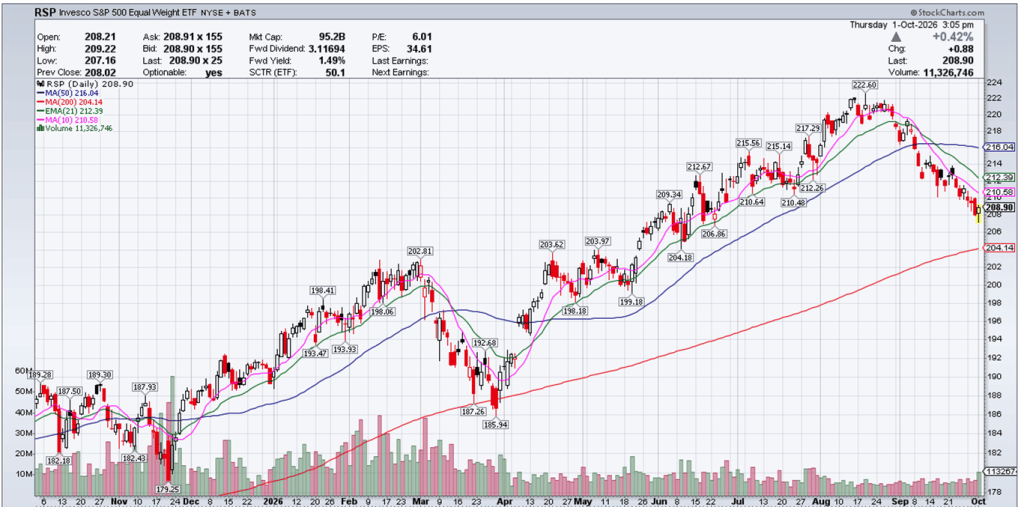
The breakdown in RSP reveals the current rally in the S&P 500 is being driven by a small number of stocks (the usual large tech suspects), while the average stock is actually declining. Such narrow performance is not a positive technical sign, however, we could also argue that narrowness has been, and continues to be, the defining characteristic of this rally.
In other words, the majority gains over the past several years was carried by a handful of tech stocks. As long revenue, earnings, and growth in aggregate continue to support prices, then its business as usual for the markets and the show can go on. We could argue about whether that’s right, ideal, or healthy, but that won’t change the facts about what is happening.
INVESTING VIEW
For investors, the wall of worry never seems to get any lower. Whether it’s oil prices, interest rates, or market breadth there are always reasons to be fearful. Yet, for all the uncertainties, one thing is abundantly clear. Markets are unpredictable and sitting in cash and waiting for the perfect time to invest is almost always a losing strategy.
Case in point, the S&P 500 has returned an annualized 22.7% since the height of the COVID pandemic. Over the same period a cash savings account would have yielded 2.9%. Yes, you could have lost money in stocks within that time frame. However, over longer periods (like 10 or 20 years), even that advantage erodes for cash.
The bottom line is, despite the worries, our MA portfolios remain fully invested according to their strategic target risk levels. At the same time, we’re not dismissive or blind to downside risk. We are acutely aware of what elevated valuations could mean for drawdowns. That’s precisely why we are at target weight and not over weight risk. Furthermore, we stand ready to de-risk when circumstances call for it.
As always, we will actively adjust our positions as conditions change. We’ll keep you informed of what we’re seeing and doing along the way.
—
Victor K. Lai, CFA


You must be logged in to post a comment.