OVERVIEW
The third quarter began with a broad rebound in risk assets. The global equity market regained +13% from its June lows by mid-August. However, sentiment turned again and markets have been volatile since.
Year-to-date the global stock market is down near-26%. Emerging markets fared worse, down close to -28%. The losses are broad even bonds and safe havens like Treasuries and gold are down, creating a global financial market with nowhere to hide.
Figure 1: Global Markets

MACRO VIEW
Investors should heed the adage “don’t fight the Fed.” Stock market action has reacted to the Federal Reserve’s policy moves all year long, summarized by the chart and timeline below.
Figure 2: Don’t Fight the Fed

In January, the Fed telegraphed intentions to tighten monetary policy, sparking widespread market pessimism to start the year.
In March, stocks rallied after Fed Chair Powell confirmed the Fed was planning a 25 bps move for its first rate hike. Investors concerned about a hawkish Fed celebrated Powell’s commentary as dovish.
In April, the Fed communicated it was willing to be more aggressive and even signaled a potential 50 bps rate hike for May. That sent stocks to new lows, but prices stabilized after the 50 bps move came and went as expected.
In early June, the market fell to a low for the year after the Fed surprised with a higher-than-anticipated rate hike of 75 bps.
In late June, whispers of a potential “Fed pivot” suggested the Fed may be less aggressive than expected if inflation eases. Factual or not, it was what investors wanted to hear and enough to fuel an 18% rally from June’s low.
In August, Chair Powell clarified there was no dovish pivot and the Fed intended to stay the course. That brought us to the abrupt risk reversal still in play at the end of Q3.
Some investors continue to be hopeful the Fed is nearing the end of its hiking cycle. That end is important because historically, the stock market doesn’t bottom until well after the Fed stops raising rates. In fact, it typically doesn’t bottom until the Fed nears the end of rate cutting.
Figure 3: Fed Funds Rate (blue) vs US Stock Market (red)

In August I wrote the “terminal rate” for Fed hikes has lowered over time. However, this time could be different (dangerous words, I admit). The problem is inflation remains stubbornly high. With the latest headline CPI numbers running at 8.3% annualized, interest rates are still negative in real terms.
A 3% handle on the 3-month Treasury yield may be the highest in over a decade. But after adjusting for inflation, the real yield is below negative -5%, the lowest in more than two decades.
Figure 4: Real 3 Mo Treasury Yields

Negative real yields imply Fed policy is still too loose, and higher rates are needed to tighten conditions. The Fed is aware of this and Chair Powell succinctly confirmed so much in his August statement. Investors should not hold their breaths or onto hope for a pivot anytime soon.
MARKET VIEW
Some were hopeful the June – August rally marked the end of the bear market. Various technical studies made that case. For example, the extreme, lopsided down volume we saw in June was the type of “wash-out” needed for a trend reversal. Also, the 50%+ retracement from June’s bottom was not only rare but in the context of bear markets almost always marks the start of a new bull.
As I wrote recently, market rallies can start on technical strength, but they need fundamental support to be sustainable. The problem with June’s rally was economic conditions were deteriorating since late last year as implied by leading indicators.
Figure 5: Leading Economic Indicators (blue) vs Stocks (red)

Then there’s still the nagging, unresolved issue of market valuation. After this year’s drawdown, the S&P 500 is less extremely overvalued than at the start of 2022. However, a current 18x price-to-earnings ratio (P/E) is not close to “bottom levels.” It’s not even below the long-term average of 16x, and far from the single-digit P/Es of prior major bottoms.
Figure 6: S&P 500 Trailing P/E Mulitple
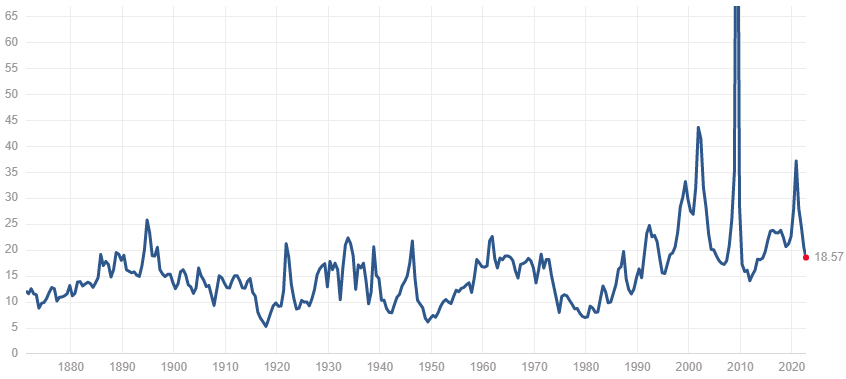
The overvaluation is more pronounced when looking at normalized measures like the Shiller CAPE (which averages earnings over 10 years). From this view, we’re even farther from average valuation levels.
Figure 7: S&P Shiller CAPE Ratio

These valuations are more concerning because S&P earnings ended 2021 at all-time highs and earnings growth has been decreasing since. That translates to a falling denominator (earnings) in the P/E and the need for a corresponding move lower in the numerator (price) to reach average P/E levels.
To be clear, valuation is a blunt tool that is terrible for marketing timing. The CAPE began 2021 with an extreme reading of over 35x but ended the year with a +27% gain. So valuation data is not predictive short-term and not good information to trade on in itself.
Valuation is more useful as a gauge of the potential magnitude of drawdowns when they do occur. Quite simply, what goes up must come down, and the higher they are, the farther they fall. Current valuation implies stocks have further to go until we reach a durable bottom.
INVESTMENT VIEW
The silver lining is economic and market indicators are aligning to provide a clear signal. Even the Fed is not holding any punches as it explicitly warned the public to expect “some pain” ahead in economic and market conditions.
At BCM, that understanding helped us avoid getting sucked into the “head-fake” rally of Q3. Our Macro Allocation (MA) strategy continues to maintain maximum tactical underweight risk exposure versus their strategic targets.
Unfortunately, the Fed’s aggressive rate increases also resulted in losses in bonds and fixed-income markets. Even beyond stocks and bonds, from real estate to gold and even crypto, markets were down across the board and there was nowhere to hide.
In response, we also increased our allocation to short-term fixed-income investments (STFI), namely, Treasuries, investment-grade credit, and, money market securities. Near term, we expect STFI is best positioned to weather the multiple storm fronts of rising rates, inflation, recession, and ongoing equity bear market.
Although yields are still relatively low (and negative in real terms), they are the most attractive we’ve seen in a long time, with some one-year yields over 4%. In addition, the stability and liquidity of STFI will be most helpful when it comes time to reallocate back into risk assets as opportunities present themselves.
That last point is especially important to keep in mind during difficult market periods such as this. We expect further market drawdown ahead but cannot predict how or when it ends. However, we know neither bulls nor bears live forever and each passing day is one closer to this bear market’s end.
Instead of speculating on price, we are focused on protecting portfolios against extreme moves and surviving whatever volatility lies ahead. We do that by reducing our risk allocation, holding broad diversification, increasing liquidity, and staying vigilant of changing economic and market data. At some point conditions will signal increasing risk allocation. We are positioned to do so and will be ready whenever that time comes.
—
Victor K. Lai, CFA

You must be logged in to post a comment.