
Equity markets bounced in June, reinvigorated by strong employment data, “no recession” calls from key policymakers, and hopes the Fed would “pivot” away from aggressive rate hikes. Some believed June marked the bottom and we were starting a new bull market.
I wasn’t convinced by policymakers and wrote markets may want to hold the champagne and confetti. Almost on cue, the Fed poured cold water on fired-up markets during its August 26th statement at Jackson Hole when Chairman Powell stated there was no pivot and higher rates will bring “some pain to households and businesses.”
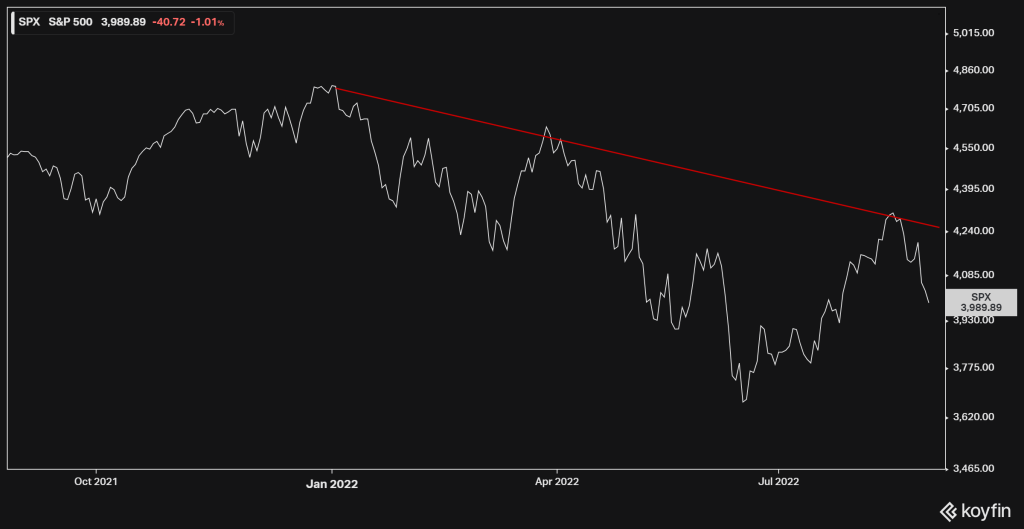
The message was concise. The Fed is intent on lowering inflation and will hike rates to do so, even if it means economic pain. The stock market heard the message loud and clear and abruptly reversed course. The price action resulted in another failed upside rally on SPX and added to a series of lower highs. Unfortunately, the trend remains negative for stocks.
Figure 1: S&P 500
There’s more to it than a recent stock chart or Fed statement. At BCM, we’ve maintained a cautious view for most of 2022 due to deteriorating fundamentals. Leading economic indicators peaked last year and have been deteriorating since, even during the stock market’s intermittent rallies. In Figure 2, note the divergence between US stocks (red line) and the negative trend in leading economic indicators (blue line) during June – July. Rallies can start on technical strength but need fundamental support to be sustainable.
Figure 2: Stocks vs Leading Indicators

That being said, the Fed’s actions clearly have an impact on economic and market conditions. Following the Fed’s August statement, investors are recalibrating their estimates of the Fed’s “terminal rate” and how high they expect the Fed will go. The truth is nobody knows, including the Fed itself. But history provides some perspective.
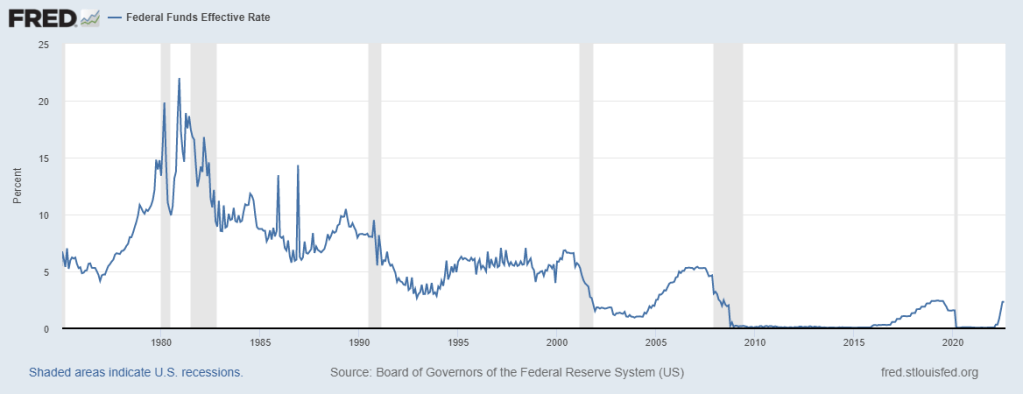
In the past, the Fed basically raised rates until something broke – be that banks, tech stocks, housing, or something else. Since the 1980s “things broke” at successively lower levels of interest rates. In the 1980s the federal funds rate (FFR) reached double digits. Prior to the dot-com crash, it topped out near ~7%, down to ~5% before the financial crisis, and only ~2.5% before the pandemic. Currently, the effective FFR is ~2.3%.
Figure 3: Federal Funds Rate
I have no special insight on the matter, but I suspect it has something to do with debt levels. As debts rise, so does the cost of rising interest rates and it takes smaller increases for things to break. US debt levels speak for themselves (Figure 4). But that’s just my guess and a tangent.
Figure 4: Federal Debt

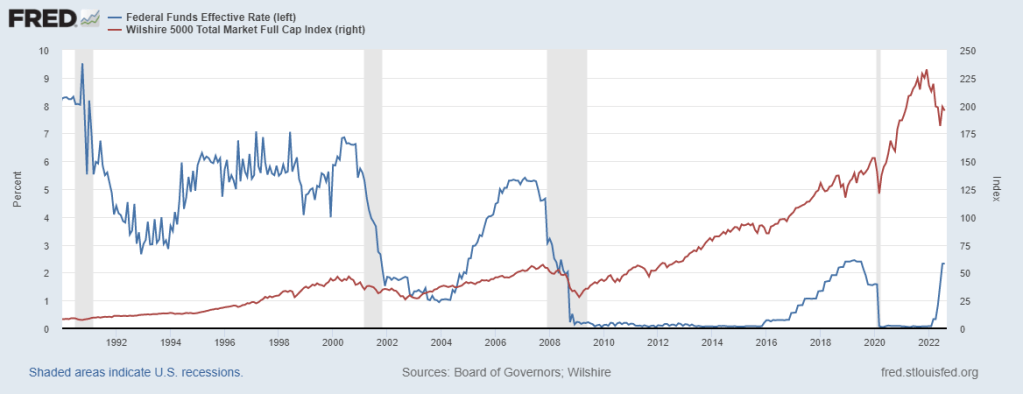
Predicting the exact terminal rate is less important than understanding the Fed will hike until something breaks. Furthermore, maximum pain doesn’t strike until that something breaks and the Fed moves to cut rates in response. Note in Figure 5 the stock market (red line) historically doesn’t bottom until AFTER the Fed cuts rates (blue line).
Figure 5: FFR vs Stock Market
That the Fed is still raising rates and telegraphing further hikes tells us there is likely more economic and market pain ahead. To Chairman Powell’s credit, he was clear and direct on that point. Things are not yet broken, this cycle and ride are not yet over. So hold on, and yes, continue to hold off on the confetti.
—
Victor K. Lai, CFA

You must be logged in to post a comment.