Financial markets continue charging higher as we head into Q4 2025. As of Q3 end, global equity market prices were up +18% (ACWI) and U.S. bond market prices advanced +3% (AGG) YTD. Gold remains the big outperformer, with YTD price up by +45% (GLD)!
Global Markets Q3 2025 YTD

MACRO VIEW
Economic conditions have been perplexing all year. The on and off again posturing of tariffs and policy changes are leaving consumers, businesses, and even countries with uncertainty. That leads to difficult long-term planning, and hasty short-term decision-making.
The dip in Q1’s GDP numbers were a good example. The U.S. experienced an abnormal and substantial spike in imports during Q1 as businesses moved to get ahead of looming tariffs. That made net exports so negative, they dragged down GDP growth to -2.9% in Q1.
Gross Domestic Product
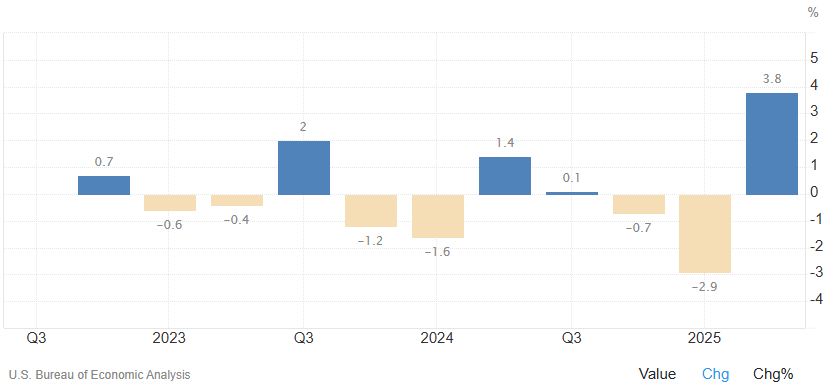
Yet, the negative headline number hid that other components of GDP, like all-important consumption, were still positive for the quarter. In hindsight, we can see how GDP rebounded sharply in Q2 after tariff fears eased.
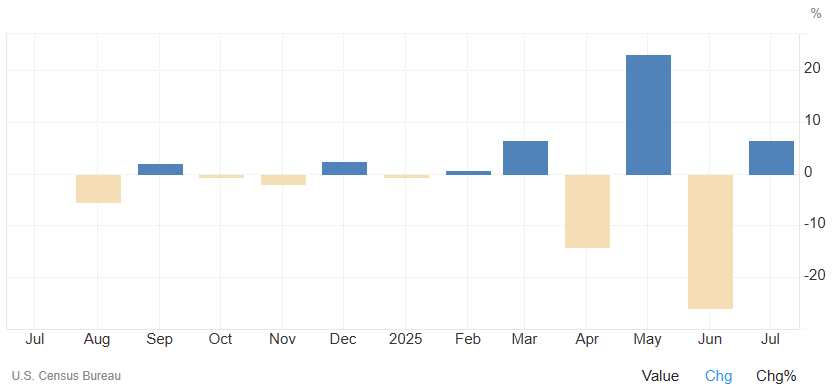
Another example is seen in Durable Goods Orders, a proxy for investment. Orders were fairly steady over the past year, but began to fluctuate wildly in April. That reflects the difficulty of making long-term investment commitments in the face of changing policies.
Durable Goods
So, are the numbers good or bad? That depends on the reasons for the changes. Are they due to fundamental changes in economic conditions, like real shifts in aggregate demand? Or are they due to short-term speculation and knee-jerk reactions?
Normally, we could expect economic data to reflect the former. Unfortunately, even historically reliable data is seemingly not so reliable right now. For example, President Trump recently fired the U.S. Bureau of Labor Statistics chief over what he claimed were “rigged” and “faked” employment numbers.
In addition, the administration has been placing unprecedented pressure on the Federal Reserve to cut interest rates. Yet, Chairman Powell and the Fed have insisted on delaying cuts due to lingering uncertainty on inflation and trade policy. Although the Fed finally moved to cut in September, it did so with hesitation and bated breath about elevated risks ahead.
Regardless of who is right or wrong, it’s evident economic data have been curiously volatile this year. That makes them less reliable than usual and more difficult to interpret. The optimistic view is a change in administration warrants an adjustment period, and data quality should improve ahead, assuming policies become more definitive and surprises less frequent.
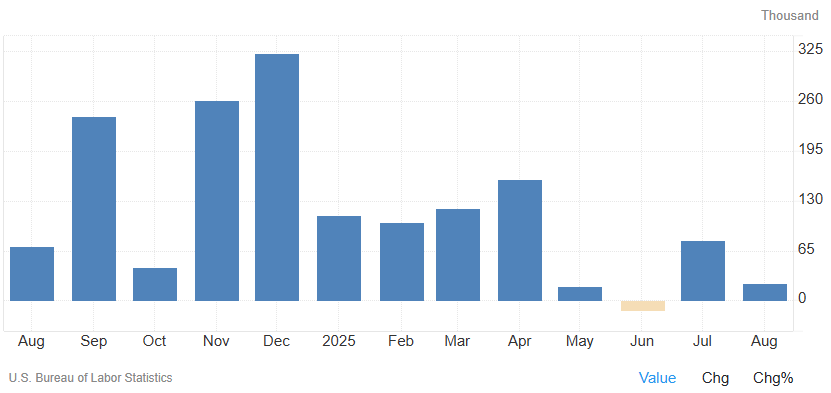
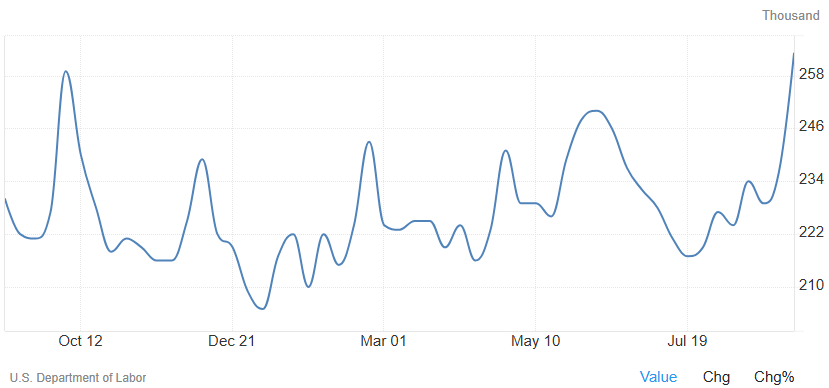
Meanwhile, the data are what they are. Recent employment data, however criticized, looks marginally worse. Non-farm Payrolls are worse year over year and look to be in a declining trend YTD. Likewise, Initial Jobless Claims also look worse year over year and in an uptrend YTD.
Non-Farm Payrolls
Initial Jobless Claims
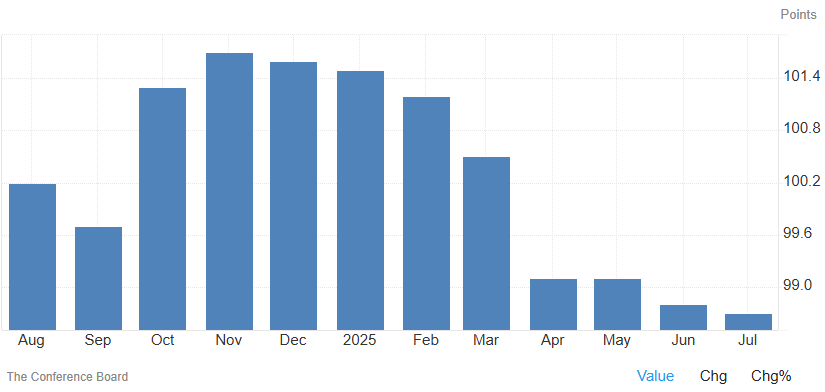
Additional leading indicators, as summarized by The Conference’s Board’s Leading Economic Index, also show a sharp decline this year, most notably since April.
Leading Economic Index
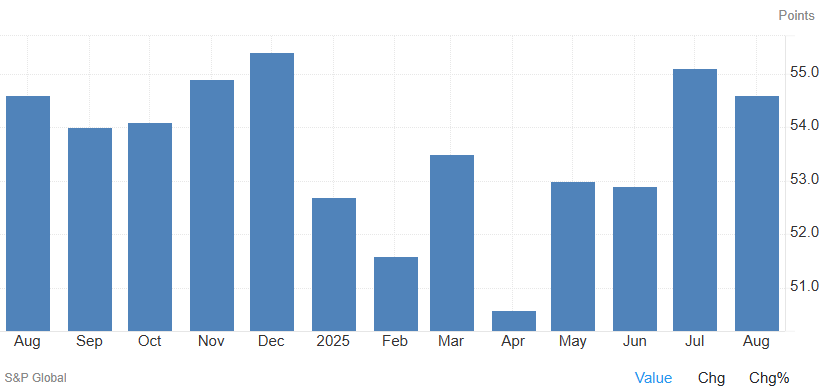
To be fair, some leading indicators still look positive. For example, Composite PMI data gathered by S&P Global show a holding recovery since April’s lows.
Composite PMI
Taken together, what we see are current cross currents of ambiguity and uncertainty. Yet another impending government shutdown won’t help.
MARKET & INVESTING VIEW
Investors usually don’t like uncertainty, and gold’s remarkable YTD outperformance reflects that. However, markets at large also don’t seem bothered this time around as stocks and other risk assets set relentless new highs.
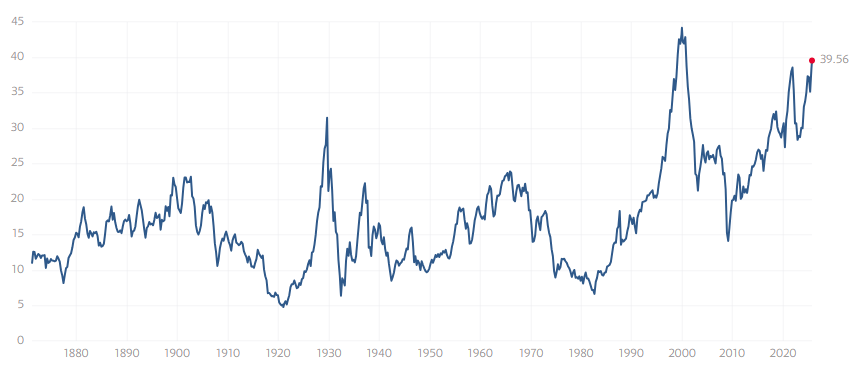
Investor optimism can be observed in the S&P 500’s Cyclically Adjusted P/E Ratio (or CAPE, a measure of long-term stock market valuation) which is near 40x. That’s already the second-highest level in history, and is approaching the all-time high of 44x reached at the peak of the dot-com bubble.
CAPE Ratio
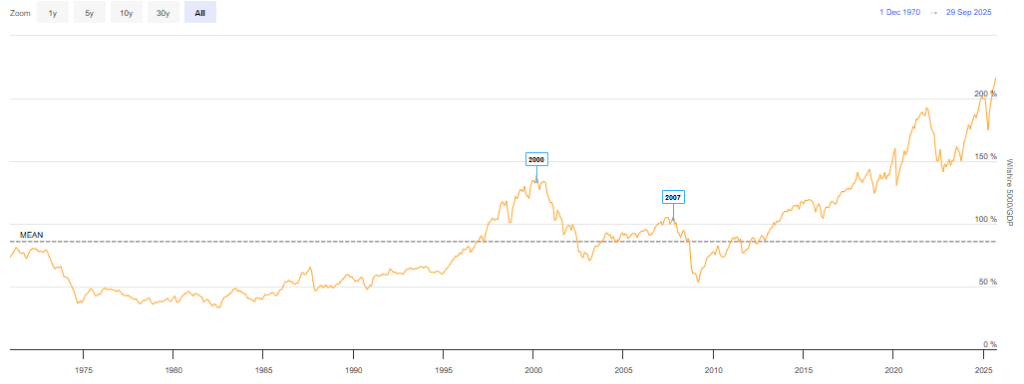
Another popular market valuation indicator, Market Cap / GDP (aka the “Buffett Indicator“) has reached the highest level on record, at over 200%.
Market Cap / GDP
Does that mean prices can’t continue to rise? Of course not, every all-time high is set to be eclipsed at some point. Bull markets don’t have expiration dates and can run farther and longer than anyone expects.
However, if market history has taught us anything, it is that prudent investors should handle periods of extremes with delicate balance. That is, don’t end up in one extreme position, trying to offset or take advantage of another with unpredictable outcomes!
In practice, that means our Macro Allocation portfolios remain fully invested across equity and fixed income, but with a tactical underweight of risk assets like stocks, and an overweight in non-risk assets like high-quality bonds.
Within equities, we continue to favor international markets versus the U.S. market due to lower valuations and lower concentrations in the technology sector. Within fixed-income, we increased our average duration prior to the imminent rate cuts, and favor government bonds due to narrow credit spreads.
This prudent positioning represents a careful balance between participation in markets that may continue to run, and caution in recognition of changing conditions that could quickly fall apart. We expect more clarity on economic and market conditions as the year progresses.
We will be ready to make adjustments as conditions change and will keep you apprised of what we see and do along the way.
—
Victor K. Lai, CFA

You must be logged in to post a comment.