The global equity market continued its upward trend in Q2, albeit at a subdued pace versus Q1. Global stocks are up +11.5% year-to-date as of Q2 end (represented by ACWI below), with U.S. big tech still leading the way. Gold held onto its gains, up +12.9% through Q2, while the bond market remained a laggard. Bond prices were down -2.5% YTD (represented by AGG below).
Global Markets YTD

MACRO SUMMARY
U.S. GDP growth slowed to an annualized rate of +1.4% in Q1. That was below consensus expectations of 1.6% and it marks back-to-back quarters of slowing growth. Whispers of a hard landing are already resurfacing, but it’s probably too soon to cry wolf.
U.S. GDP Growth

Part of the slowdown may be seasonality. It’s common for U.S. GDP to rage into year-end holiday festivities only to hangover in the new year. Also, GDP is a coincident indicator, not forward-looking.
Leading indicators related to interest rates and employment show continued strength and resilience in the economy. For example, high-yield credit spreads (a gauge of financial stress in the credit markets) are near their lowest level in decades.
High Yield Credit Spreads

Meanwhile, initial jobless claims (a gauge of weakness in the employment market) are also bouncing around multi-decade lows.
Initial Jobless Claims
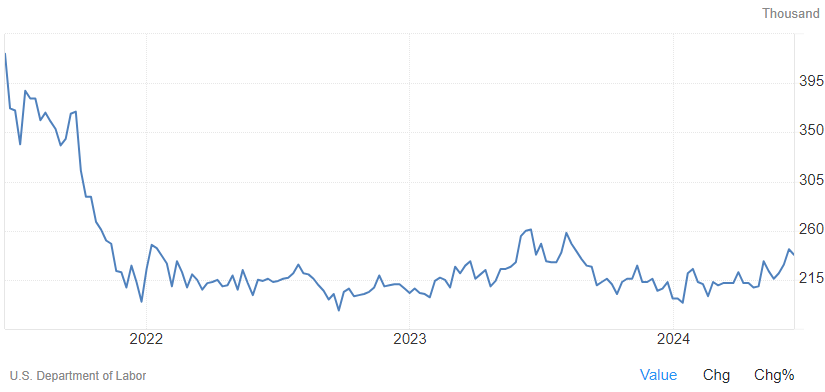
Employment strength deserves special attention because it propped up the U.S. economy in 2023 and fended off a widely expected recession. While other indicators flip-flopped, employment was steadfast and still appears so.
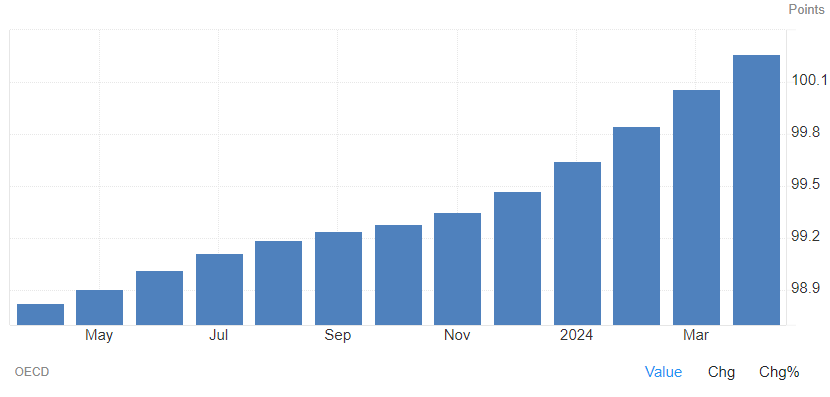
Broader leading indicators are also resilient. The most compelling right now is the OECD’s U.S. Composite Leading Indicator (CLI), which seeks to forecast economic activity 6-months ahead. The latest CLI reading marked a 13th consecutive improvement. Overall, the U.S. economic outlook remains positive, for now.
OECD U.S. CLI
However, the economy still faces some obvious challenges. The most prominent being the Federal Reserve’s aggressive interest rate hikes over the last 2 years. At present, the world still holds its breath anticipating Fed rate cuts.
Yet, the Fed remains hesitant due to persistent inflation. This has resulted in the longest inversion of the U.S. Treasury yield curve ever. This matters because an inverted yield curve causes dysfunction in the economy.
U.S. Treasury Yield Curve
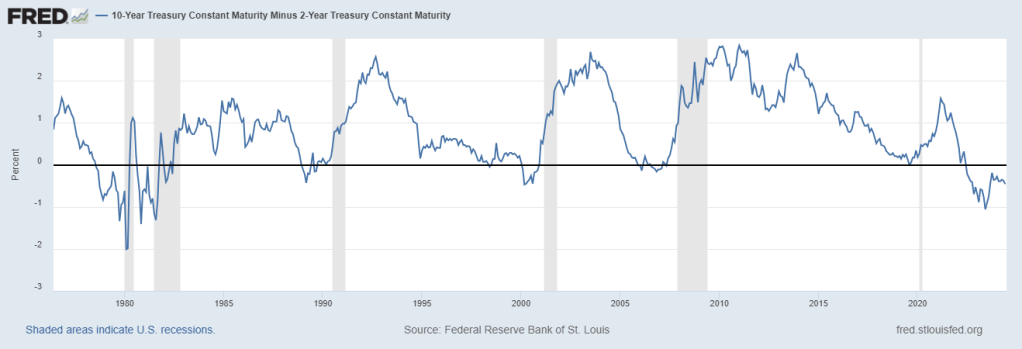
Normally, people and financial institutions borrow at lower short-term rates and invest at higher long-term rates. An inverted yield curve flips it so short-term rates are higher than long-term rates. This thwarts investment and economic activity, and eventually leads to economic weakness.
The Fed cuts short-term rates in anticipation of that weakness. That causes short-term rates to fall faster than long-term rates thereby reverting the yield curve. The cuts are meant to stimulate the economy and to avoid recession, aka to “engineer a soft landing.” Unfortunately, the Fed’s track record on soft landings is not encouraging.
Former Fed Chairman Alan Greenspan is often credited with cutting and avoiding a recession in the mid-1990s. However, he is just as often (if not more) criticized for fueling the Dot-Com Bubble that resulted in what was likely an even worse recession. In that sense, the recession was delayed rather than avoided.
The point is the inverted yield curve is a bad look for the economy, and this economic plane probably lands like others before it. However, timing is always uncertain, and this plane can coast longer than people expect (and it has). Until we see the Fed cut rates and the yield curve revert it’s probably too early to cry wolf or recession.
MARKETS SUMMARY
The upward trend in global risk assets remains intact, as proxied by the All Cap World Index (ACWI). Global momentum continues to be positive and prices look less overbought than in May.
Global Stocks (ACWI)

Within global stocks, the U.S. market is leading the way and is also an exception. The S&P 500 (SPY) is on a strong uptrend but appears overbought and more likely to see a near-term pullback versus the broader global market.
Q1 saw an improvement in U.S. market breadth with increasing stocks participating in gains. Notably, we saw an easing return concentration in a small number of large tech stocks (the Magnificent 7) versus the broader market (S&P 500).
That was a positive change because concentration reflects unfavorable conditions for the broader market (i.e. when only a few stocks are worth buying). A broadening out of returns helps market rallies become more durable and sustainable.
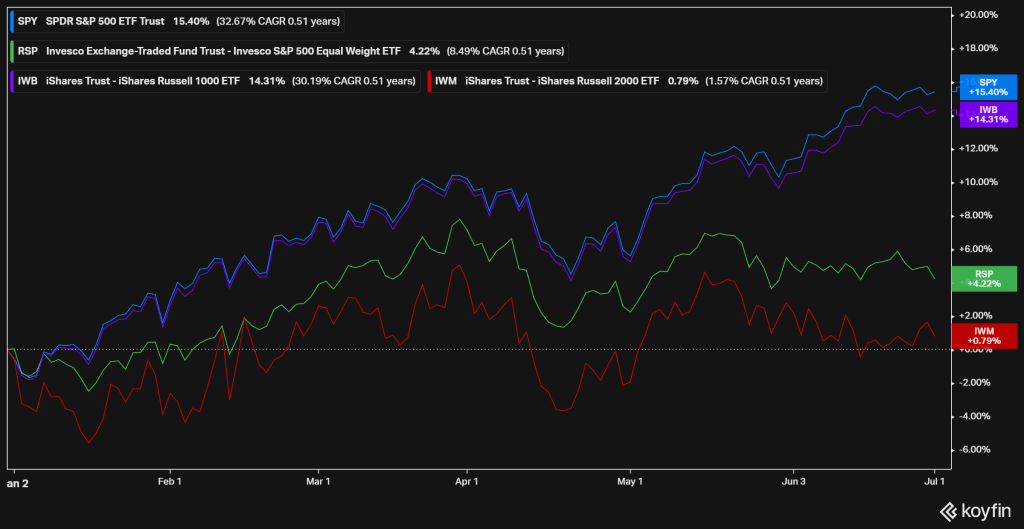
Unfortunately, concentration reemerged during Q2 with big tech again pulling away from the rest of the market. An equal-weighted measure S&P 500 (RSP) was negative in Q2, while the tech sector led a market-weighted S&P 500 (SPY).
This is shown as SPY (in blue) and RSP (in green) in the chart below. Similar convergence and divergence can be seen with the Russell 1000 large cap index (IWB in purple) versus the Russell 2000 small cap index (IWM in red).
Return Divergence
Overall, the big-picture trend in risk assets is still up, still positive, and still friendly. Weakening internal measures in the U.S. (like breadth) suggest markets may be setting up for a near-term correction. But that wouldn’t be unjustified given the strong returns stocks have seen in the past year.
THE BOTTOM LINE
Global economic conditions and the near-term outlook remain positive overall. Elevated interest rates in the U.S. remain a germaine risk, especially if they start to meaningfully curtail investment and all-important consumption. However, that is not yet definitively observed in economic data.
On the contrary, leading indicators like employment and credit spreads remain resilient. Our expectation is economic conditions will not be a concern until the Fed moves to cut interest rates. And even then, it likely will not be until the Treasury yield reverts that it will be time to cry recession.
Meanwhile, overall market conditions for global risk assets are also positive. Market measures like breadth and overbought price levels warrant some near-term caution, particularly in U.S. stocks. However, those concerns alone do not warrant a move out of stocks and risk assets altogether.
As such our Macro Allocation models remain at their strategic risk targets. We will maintain our risk exposures until we see clear and evident reasons to change them. We’ll update you with what we see and do along the way.
—
Victor K. Lai, CFA

You must be logged in to post a comment.