
US equities bounced hard off their March lows. The disconnect with fundamental data has many intelligent investors trying to explain the rally with acronyms like FOMO and TINA.
But the best explanation may come from the original Intelligent Investor Benjamin Graham who said, “in the short-run, the market is a voting machine, but in the long-run, it is a weighing machine.”
In other words, stock market prices are often driven by technicals like price momentum in the short-term but tend to be explained by fundamentals like earnings growth in the long-term.
Investors vote
Stock market prices have been voted up recently, but the rally may be less popular than it seems. Figure 1 shows S&P 500 prices over the last year (represented by SPY).
Figure 1: SPY
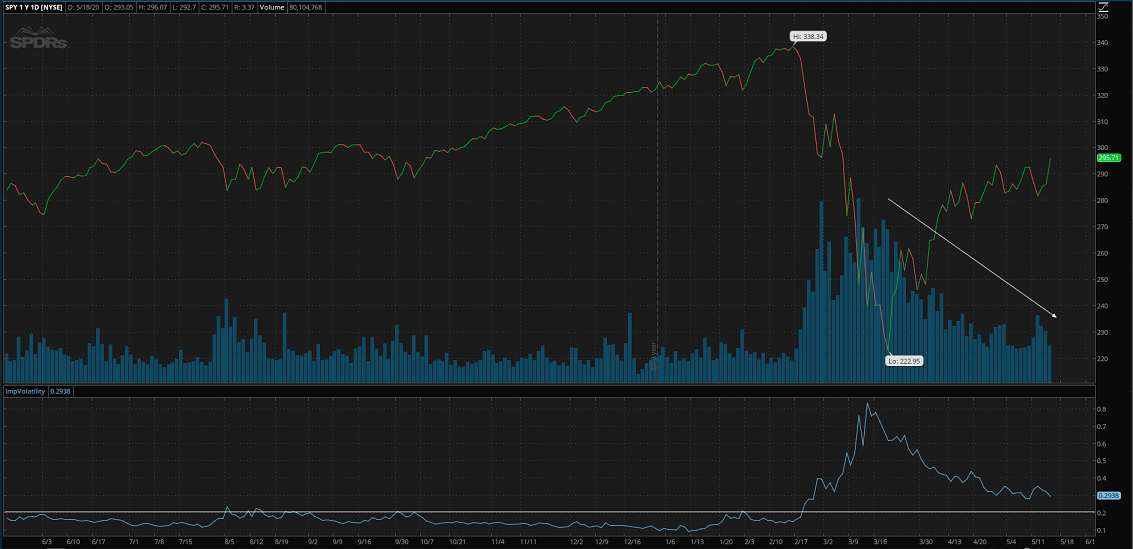
Source: Think or Swim
While stocks clawed back more than half their Q1 drawdown, it’s worth noting the rally is advancing on weakening volume (blue bars in the top panel of Figure 1).
Not only was volume significantly higher during the selloff, but during the past month, down days have also had the highest volume.
And although implied stock market volatility has retreated from its spike in March, it remains elevated near the 30-mark and stubbornly above the “all-clear” level of 20 or lower (bottom panel of Figure 1).
Taken together, volume and volatility indicate the market has less confidence in the popular vote for prices, implying a near-term reversal is coming.
Fundamentals weigh
Longer-term, market prices tend to converge with fundamentals, and the data is not supporting recent price moves.
For example, last month I wrote consensus earnings estimates for the S&P 500 seemed unreasonably high. As of March, average analyst estimates were forecasting a 10% decline in reported EPS for 2020 (YoY from 2019).
Figure 2
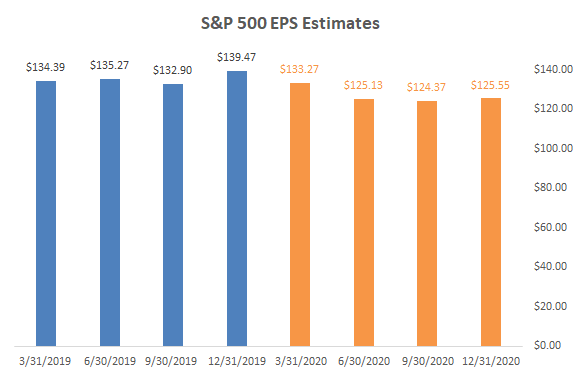
Source: Standard & Poors, BCM, as of 3/31/2020
Those estimates were at odds with economic forecasts. For example, the IMF expects the worst economic downturn since the Great Depression. I suspected 2020 earnings would be revised downwards and since then the consensus EPS estimate for the S&P 500 has fallen to $95.16.
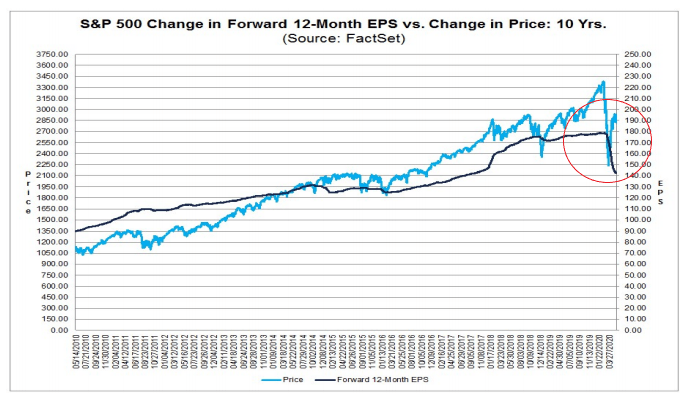
Meanwhile, market prices have mostly turned the other way. Figure 3, from Factset, shows the divergence between S&P price and earnings estimates.
Figure 3
Looking forward
The devil’s advocate argues the stock market is forward-looking and already focused on a coming “V-shaped” recovery.
That’s certainly possible. To be honest, regardless of what the technicals or fundamentals imply, nobody knows what happens next.
My guess is the risk/reward on stocks is skewed to the downside.
The spectacular bounce off the March lows expects an equally spectacular recovery and calls for an even greater spectacle to move higher.
Results that are as expected or worse provide market prices with little support against fundamental gravity. That’s 2 out of 3 and unfortunately as much certainty as we can expect when looking forward.
Ironically, I write this on a day when the S&P jumps +3%. While I search for an intelligent explanation, it’s like the late, great Graham himself whispered in my ear, “it’s the VOMA, stupid” (voting machine).
—
Victor K. Lai, CFA
