Like the saying goes,”beauty is in the eye of the beholder.” It turns out the same can be said about stock market valuation. In December, I wrote the U.S. equity market eclipsed an all-time-high in terms of market cap to GDP.
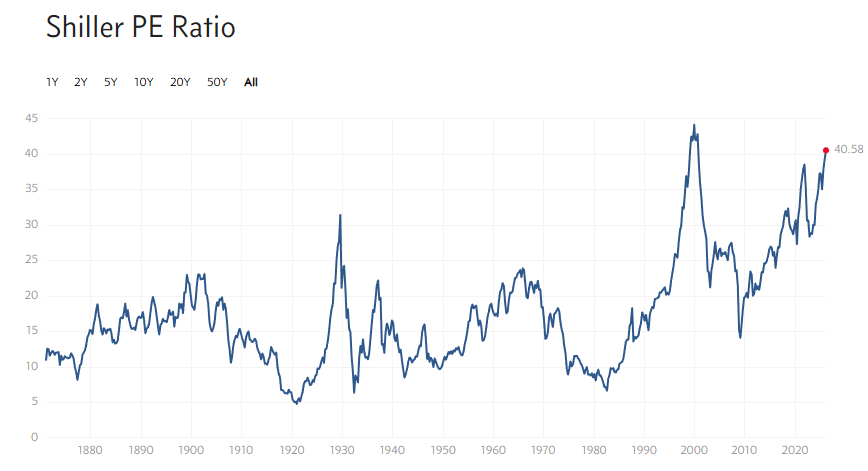
Yet, other measures look different. For example, the venerable Shiller P/E Ratio shows the S&P 500 hasn’t surpassed the high reached during the Dot Com Bubble. Sure, the Shiller P/E is high, but 2000 showed it can go even higher. Judging by MC/GDP, maybe much higher.
If we look at the current P/E ratio, valuation looks less extreme. Especially compared to the Great Financial Crisis, albeit the negative earnings of that period caused an abnormal spike.
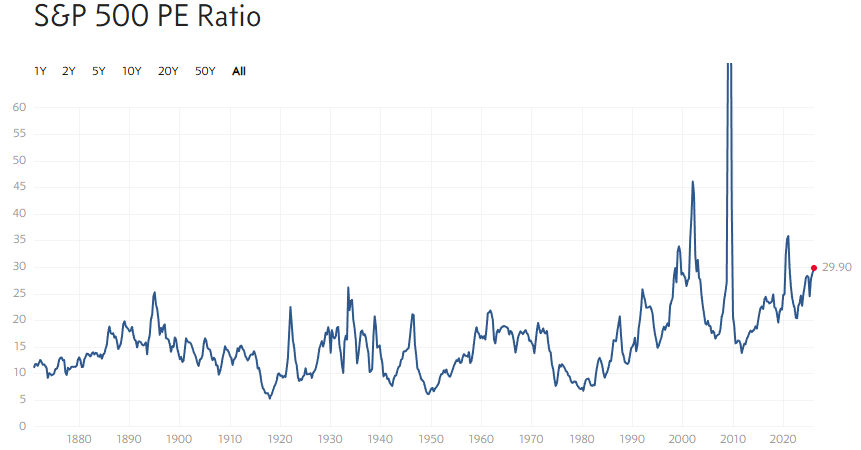
A P/E of 30x is still relatively high, but if we look hard enough, it doesn’t look as bad. It turns out much of the market’s extreme valuation is concentrated in big tech. The table below shows the information technology sector not only has the highest P/E but also the largest weight (influence) in the S&P 500 Index.
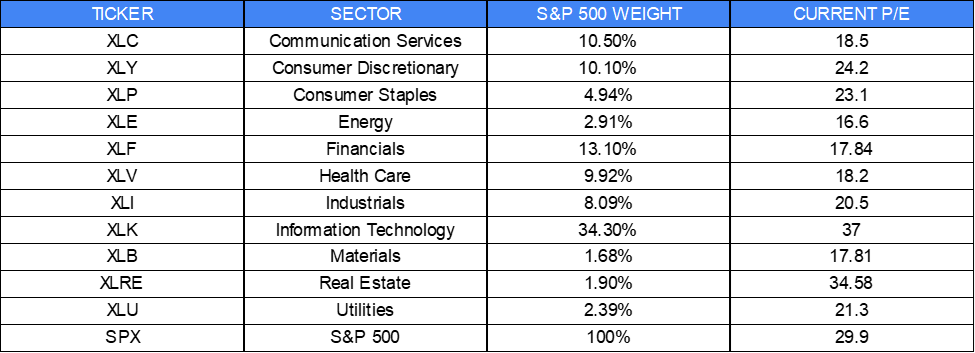
If we remove the tech sector (i.e. S&P 500 sans tech sector), the P/E falls to about 20x. Yes, that’s still above average, but only modestly, and it doesn’t look anything as bad as MC/GDP or the Shiller P/E. Some would even call it a beautiful thing because it suggests the market has more room to run.
The point is market valuation isn’t absolute. It’s often relative in the eye of the beholder. What looks excessive by one measure may look reasonable by another.
We have not reached a point at which every stock market valuation measure looks unreasonably valued. On the expensive side, yes. But absolutely, unreasonably valued, in these eyes, not yet.
—
Victor K. Lai CFA

You must be logged in to post a comment.