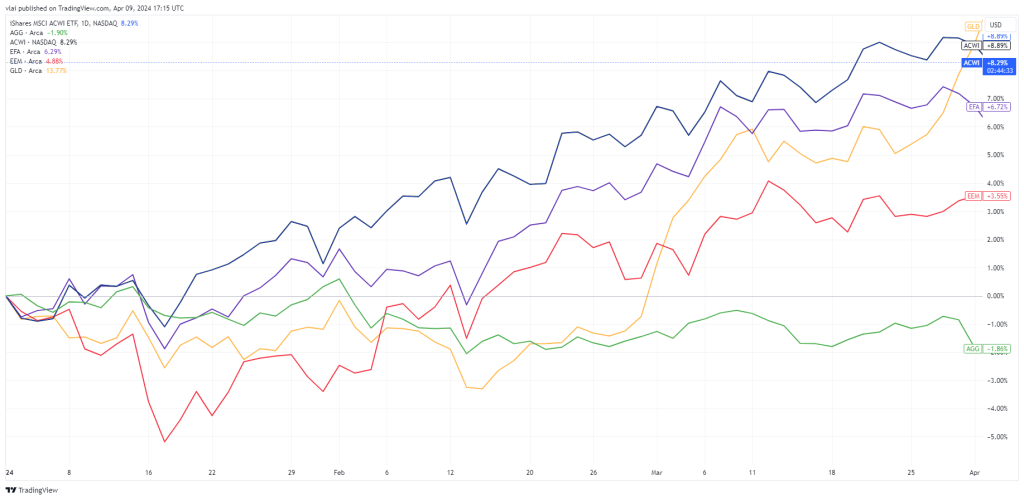
The global equity market advanced another +9% in Q1 2024 (represented by ACWI below). U.S. stocks led the way, again. The U.S. bond market (AGG) prices fell -2% over the same period. Gold prices (GLD) moved sideways for much of the quarter but jumped almost +10% in February. The biggest headline in Q1 was Bitcoin (it’s back) which rallied up +73% from January to early March, reaching a new high of over $73k per token.
Global Markets 2024 YTD
MACRO SUMMARY
Economic conditions continue their resilience in the U.S. All-important employment remains robust. Initial Jobless Claims, a leading indicator for the jobs market, are back down near historically low levels (lower is better for the economy). Jobless claims temporarily trended higher in 2023, but they never reached worrisome levels. Regardless, claims have reversed into an eight-month downtrend.
Initial Jobless Claims

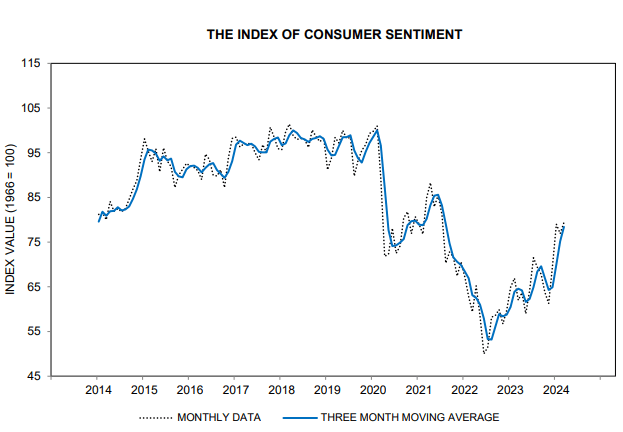
The strong jobs market is contributing to improving consumer sentiment. The University of Michigan’s Consumer Sentiment Index had a revised read of 79.4 in March. This is off of January’s high, but is still a big improvement over the past year, and the 50-levels it saw in 2022.
Business sentiment also improved. The S&P Global US Composite PMI reading came in at 52.2 in March. This indicates business activity and sentiment are still improving. Notably, the past four readings were consecutively above the 50 threshold (which indicates expansion).
Composite PMI

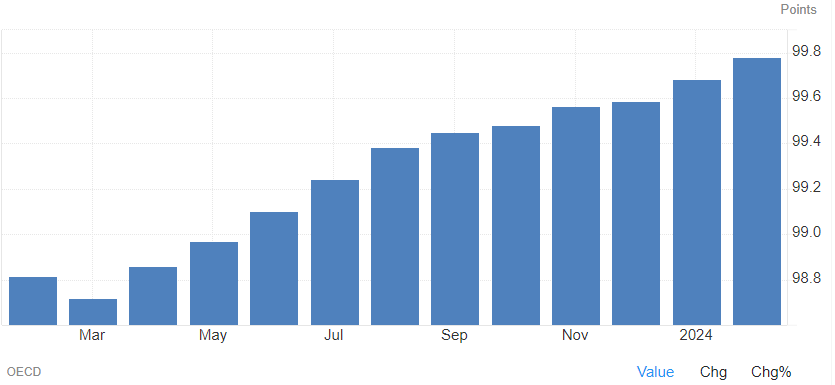
All of these improvements are echoed by the OECD’s Composite Leading Indicator (CLI). The CLI provides a broad read on economic conditions and is currently the most compelling indicator of economic expansion. The U.S. CLI posted 10 consecutive increases.
Composite Leading Indicator
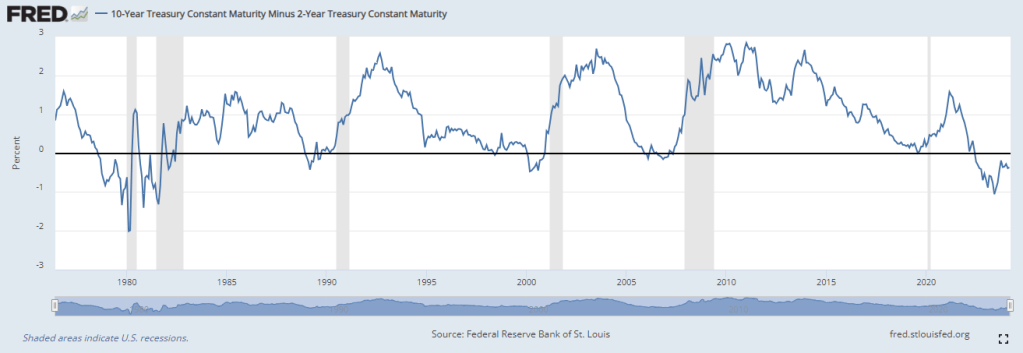
The main recessionary “red flag” still standing is the Treasury Yield Curve, which continues to be inverted. Historically and as far back as we have data, yield curve inversions have occurred before every recession in U.S. history. This is shown in the chart below as the yield curve (blue line) inverting below zero percent (black line) before every recession (grey bars).
Treasury Yield Curve
But this time the yield curve has inverted without a recession. Given the rebound in most other leading indicators, this has many people convinced the yield curve is broken as a leading indicator. That could be true, there is no such thing as a perfect indicator after all.
However, as I wrote last month, a closer look reveals something different about this inversion. Historically, inversions were short-lived, lasting only a few months. This was true of inversions that occurred before the COVID-19 Pandemic, the Great Financial Crisis, and the Dot Com bust.
Furthermore, recessions did not start until AFTER the yield curve reverted (or uninverted). As of April 2024, the current inversion will have lasted almost two years (22 months). The duration of this inversion is unusual, but the lack of a recession before reversion is still aligned with historical precedent. In other words, the yield curve’s signal may simply be incomplete instead of broken.
Does that mean a recession is imminent in 2024? No, again, this time could end the yield curve’s perfect track record as a leading indicator. However, it’s still too soon to make that statement. We would need to see the yield curve revert without a recession afterward to confirm a broken signal.
Regardless of the yield curve, other leading indicators continue to show improvement and imply that a recession is not a near-term risk.
MARKETS SUMMARY
Risk assets, as proxied by the global equity market (ACWI), continued to trend higher in 2024. A negative trend reversal looked likely last year in Q3 and Q4 when market prices fell below their 50 and 200-day moving averages (the yellow and red DMA lines below, respectively).

The recovery that began in November was just in time to prevent the 50 DMA (yellow line) from crossing below the 200 DMA (red line), a so-called “death cross.” The cross earned its ominous name because it historically happened before major bear markets and crashes. Suffice it to say the avoidance of a death cross and the resumption of an upward price trend were positive signs for risk assets.
Investor sentiment echoed that outlook. The most recent AAII Sentiment Survey showed U.S. equity investor sentiment at 43% (bullish). It reached a 1-year high of 52% in March and is above the long-term average of 38%. In addition, current readings are substantially higher than the sub-20% levels (bearish) from one year ago.

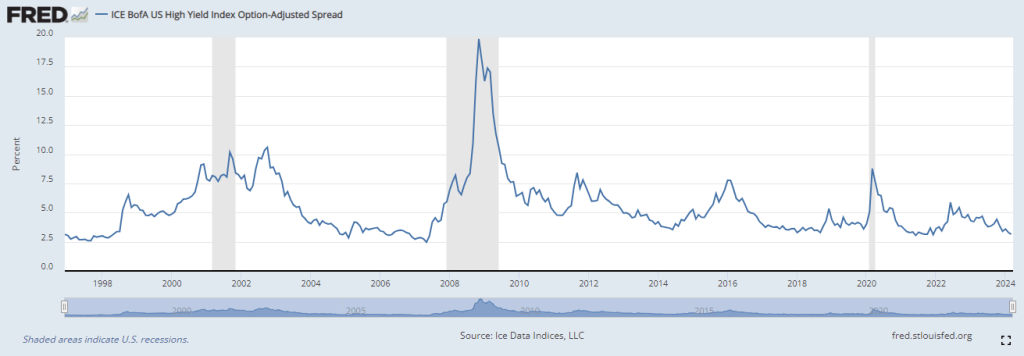
Likewise, credit spreads paint a similar picture. The ICE BoA High Yield Spread Index (which measures junk bond vs U.S. Treasury yields) is on a downtrend and near the lowest levels in decades. The low spread indicates investors are not demanding substantially higher interest rates to accept riskier bonds. In other words, bond market sentiment is good and risk appetite is strong.
These sentiment indicators reflect positive economic conditions are feeding into the financial markets. That’s normal, under normal conditions we would expect markets to rise when sentiment is improving and vice versa.
What’s important is we’re not seeing a negative surprise. In other words, we wouldn’t want investor sentiment to deteriorate as markets improve. That divergence would suggest a change in underlying conditions. As of now, that is not the case, which is a positive signal for risk assets.
Lastly on market conditions is breadth. There was a stark contrast between large-tech stock returns and the broader market in 2023. “The Magnificent 7” tech stocks accounted for more than 60% of the S&P 500’s return in 2023. There were times in 2023 when the Mag 7 accounted for more than 100% of the S&P’s returns (meaning the Mag-7 was up while the rest of the S&P 500 was down).
Magnificent 7 vs. S&P 500 2023

In other words, market performance was narrow and returns were concentrated in a small number of tech stocks. That was a red flag because healthy and sustainable bull markets typically display broad participation across stocks and sectors, much like a rising economic tide lifting all boats.
So far in 2024, we’re seeing an easing of last year’s concentration. One way to see this is to compare the standard market-weighted S&P 500 to an equal-weighted (EW) version of the index. EW removes the skew that a small number of stocks (like the Mag 7) can have on a broader index (like the S&P 500).
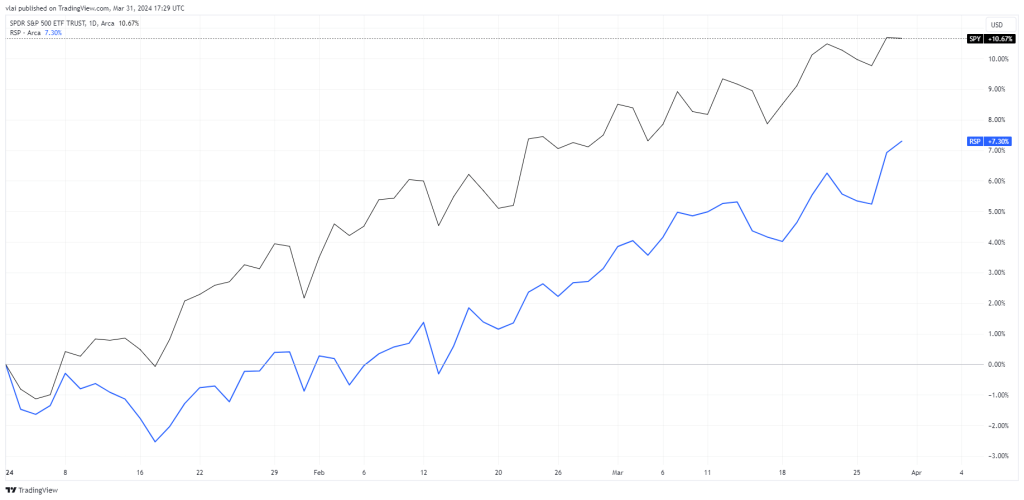
The chart below compares the standard S&P 500 index (SPY in black) to an EW index (RSP in blue). The two indices are currently more in sync and trading closer together compared to 2023. EW is still trailing S&P in 2024, but the spread is narrowing and only about ~3%. In 2023 there were times when the spread widened to double digits, and times when the indices moved in different directions.
SPY vs RSP
We’re seeing improvements in both so far in 2024. That suggests the rally is broadening out with a wider number of stocks and sectors participating. That’s another positive signal for risk assets and implies the current rally looks more sustainable than it did last year.
The primary critiques of current market conditions are in volume and momentum. Particularly in the global equity market (ACWI), we’re seeing price advances on both declining volume and momentum (yellow highlights below). This divergence suggests fewer investors are willing to buy stocks as prices move higher.
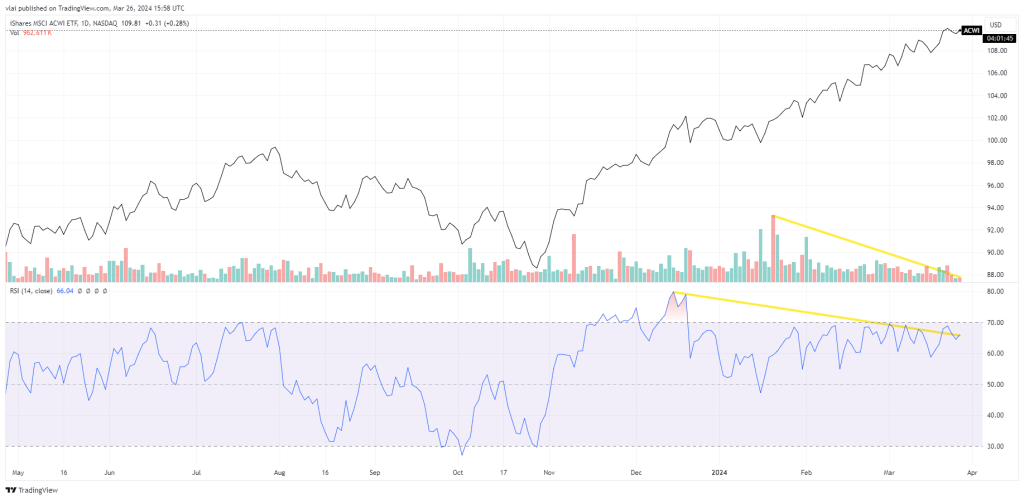
That’s reasonable after the six-month run-up in stocks. If nothing else, we should at least expect a run-of-the-mill ~10% correction, which is normal to the ebbs and flows of a properly functioning market. The fading volume and momentum reflect a healthy dose of skepticism and expectations for a pullback.
THE BOTTOM LINE
Overall both economic and market conditions continue to look positive in 2024. As such we maintain risk exposures at their strategic target weights (i.e. target, market, or neutral weight) across Macro Allocation portfolios.
However, that is not to say we remain complacent. We are aware there is no shortage of economic, market, and geo-political concerns (Ukraine, Gaza, global debt, DC dysfunction, etc). One of the most salient market-moving events is on the horizon, the timing and magnitude of the Federal Reserve’s next interest rate moves.
At present, consensus expectations are for the Fed to start cutting rates in June. While markets may celebrate the long-awaited Fed “pivot,” its arrival may mark an ironic turning point for the economy and the markets.
The reason is simple, rate cuts imply the Fed sees or expects problems or economic weakness (not strength). Also worth noting is the Fed cutting rates may be exactly what’s needed to revert (or uninvert) the Treasury Yield Curve, which would complete the yield curve’s recession signal.
Those conditions combined with existing concerns render the U.S. economy and markets vulnerable to negative macro shocks and surprises. Of course, shocks and surprises are unknown and unpredictable, but a downturn happening when the consensus least expects would not be uncommon.
All that being said, the market’s wall of worry is ever-present and seems to grow taller all the time. Despite the worries, current economic and market conditions do not warrant an underweight risk position. As such, the best strategic move is to continue climbing (and trying not to look down).
The bottom line is we will continue to do so until we see clear and evident reasons not to. We’ll keep you updated with what we’re seeing along the way.
—
Victor K. Lai, CFA

You must be logged in to post a comment.