Volatility returns
Stock market volatility is back. In February this year, the S&P 500 posted the largest single-day point fall in its history, only to rebound with the fourth largest single-day rise in history. All that volatility has some questioning if it still makes sense to invest in the stock market.
S&P 500 BEST & WORST SINGLE DAY POINT MOVES
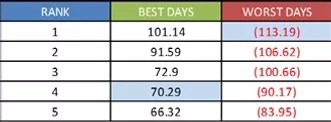
Source: Standard and Poor’s, BCM
Patience or a coin toss
The answer is it depends on how much patience you have. In the short-run, nobody knows if the market will be up or down. The truth is, over short time periods the probability of profiting from the market can be worse than a coin toss. For example, had we randomly picked a single day to hold the S&P 500 between February to March this year, we would’ve likely lost money. Out of 40 trading days, only 18 were positive. In other words, we had a 45% chance of profit.
On the other hand, if we randomly picked a single year to hold instead, results look different. From 1925 to 2017, 69 out of 93 calendar years were positive for the S&P 500. In other words, the chance of profit was over 74%. Longer periods had even better results. Based on 10-year periods, 81 out of 83 periods had positive returns – over 97% chance of profit. What’s more, the maximum loss for 10-year periods was just -10.52% versus -44.20% for single years.
S&P 500 PROBABILITY OF PROFIT
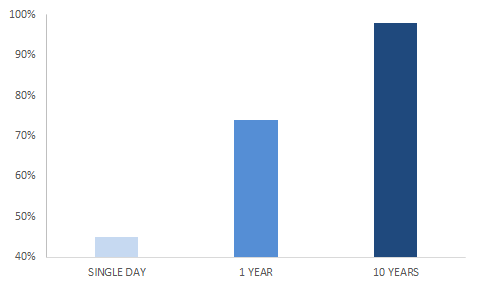
Single Day time period is 2/1/2018 to 3/29/2018, 1 Year and 10 Years time period is 1/1/1925 to 12/31/2017, Assumes buying at period beginning and selling at period end, Source: Standard and Poor’s and BCM.
The takeaway for investors is time and patience matter. The length of time you can stay invested in the stock market (undisturbed) significantly affects the likelihood of positive or negative returns.
Patience Pays
So what kind of returns can long-term investors expect from the stock market? That depends on the time period, of course, but the stock market has consistently outperformed other asset classes over time. For example, over the past 24 years, the S&P 500 has generated an annualized return of 9.57%. That would have grown $100,000 into $896,602.
RETURN AND GROWTH
Jan 1994 to Dec 2017
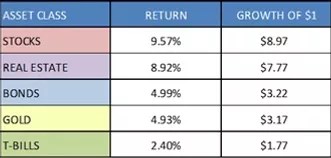
US Stocks = S&P 500 Index, Real Estate = MSCI US REIT Index, Gold = Gold Bullion Market Prices, Bonds = Barclay’s US Aggregate Bond Index, T-Bills = 1 Month Treasury Bills
Yes, that includes two of the worst market crashes ever (dot-com and financial busts). Even widely popular investments like real estate and gold did not outpace stocks. While real estate came in second place return-wise (based on US equity REITs), it was also the most risky (as measured by standard deviation). Stock market returns were not only higher, but also less volatile – even less volatile than the global “safe-haven,” gold. That means stocks outperformed in both absolute and risk-adjusted terms.
RETURN OVER RISK
Jan 1994 to Dec 2017

Y axis = Return, represented by annualized returns, X axis = Risk, represented by annualized standard deviation of returns, US Stocks = S&P 500 Index, Real Estate = MSCI US REIT Index, Gold = Gold Bullion Market Prices, Bonds = Barclay’s US Aggregate Bond Index, T-Bills = 1 Month Treasury Bills
The bottom line
Though short-term stock market volatility can be unsettling, patient investors have good reasons to stay invested. Over time, the stock market has outperformed other asset classes, making it a rewarding choice for long-term investment objectives. Of course, that doesn’t mean investors should just blindly throw all their money into stocks. Investors need to consider additional factors like their own risk tolerance, objectives, and other circumstances to develop an optimal strategy. If you have questions, need assistance, or just want a second opinion, feel free to contact BCM.
Victor K. Lai, CFA
This blog is for informational purposes only. Nothing on this blog represents advice of any kind. Investing is inherently risky and involves the risk of potential loss.
