You wouldn’t know it from watching new highs in the S&P 500, but the U.S. is in week five of the longest government shut down in its history! Whether we characterize it as complacency or optimism, it suggests many investors are throwing caution to the wind.
Margin debt reflects the amount of money customers borrow from brokerage firms to invest. It is a proxy for investor sentiment that typically rises into bull markets, and peaks near market tops. The chart belows shows U.S. margin debt versus the S&P 500, along with a familiar pattern around years 2000, 2007, and 2022.
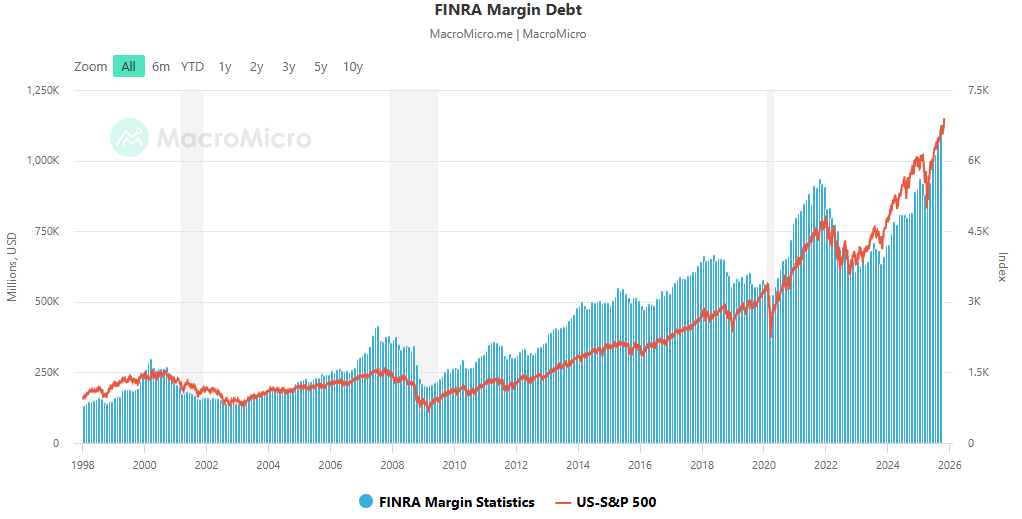
Margin debt has pushed higher with each cycle as market values inflated over time. Given current market valuation, it’s no surprise that margin debt has reached its highest levels ever.
Another investor sentiment indicator is credit spreads. Credit spreads reflect how much interest investors demand for taking risk in the bond market (versus a risk-free government bond). Low or narrow credit spreads reflect high investor risk appetite, and vice versa.
The chart below shows credit spreads for U.S. high-yield (high-risk) bonds. Spreads are near all-time lows, which reflects strong investor risk appetite.
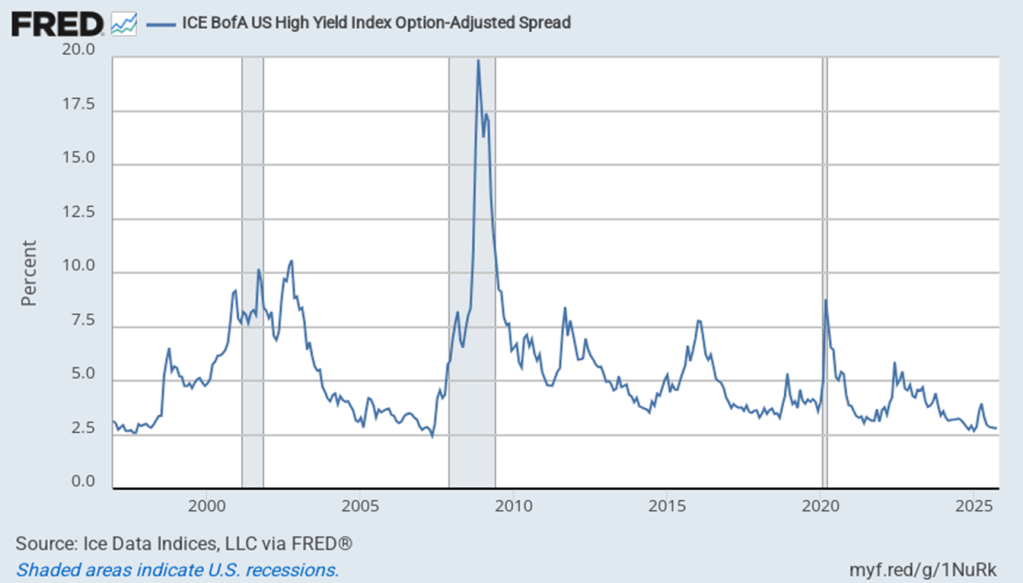
In other words, investors, on average, aren’t worried. Furthermore, they’re very willing to invest in risky assets, and even with borrowed money at that!
Meanwhile, U.S. economic conditions are moderating. The most crucial indicator to watch, as it has been, is employment. I wrote last month about a softening jobs market and the importance of watching upcoming changes.
Unfortunately, the government shutdown is affecting the release of crucial monthly employment data published by the Bureau of Labor Statistics (BLS). That leaves us, somewhat, “flying blind” through the turbulence.
We can turn to alternative sources, like the “ADP Employment Report,” but that is private and unofficial data. Still, it’s what we have for now, and it’s also not encouraging. Like BLS, ADP shows a weakening trend in job creation. However, ADP shows a net loss of jobs in three of the last four reports, something notably absent from BLS.
ADP Employment Report

Again, this is not the “official” data. ADP and BLS data are not always in sync. For example, the negative ADP read in June was not confirmed by BLS data. In addition, Fed Chair Powell recognized the weakening jobs numbers in his October rate meeting, but also emphasized the jobs market was stable, and “moving sideways” rather than weak.
Furthermore, the Fed cut rates as expected in October, but cast doubt on whether it would cut again in December. Previously, markets expected a December cut, and the Fed’s hesitancy reflects expectations of growth rather than contraction.
The point is, we should take the ADP data (and any single data point) with a grain of salt, and not jump to any panicked conclusions. As is often the case, we simply need more information. The shut-down will end, the data will flow, and we’ll have more insight on what to expect in the months ahead.
In the meantime, the combination of high market valuations, complacent investor sentiment, and uncertain economic conditions calls for prudence and balance. In terms of investment positioning, that means maintaining broad diversification with a modest underweight of risk assets. Within equities, we are underweight U.S. versus foreign stocks. And within fixed income, we favor high-quality U.S. bonds with intermediate duration.
—
Victor K. Lai, CFA

You must be logged in to post a comment.