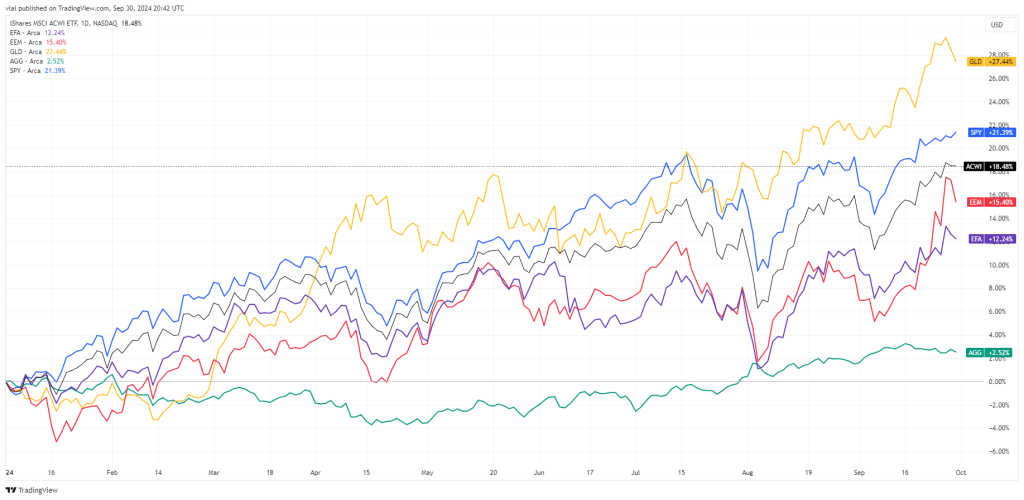
The third quarter was an eventful one for markets. After a strong first half, the global stock market lost half its year-to-date gains in August. However, stocks recovered and ended Q3 near new highs for the year. The U.S. bond market was negative for most of the year but finally turned positive in Q3. Gold continued to shine brightest and was up more than +27% YTD.
Global Markets YTD 2024
MACRO VIEW
In August, global markets saw an abrupt and substantial rise in volatility. The financial media quickly singled out the unwinding of the Japanese Yen carry trade as the root cause. The Bank of Japan announced interest rate hikes and monetary policies that were more aggressive than anticipated.
That led to an unexpected rise in Yen borrowing costs, which started a cycle of selling leveraged positions in stocks to cover short positions in Yen. Those trades led the Yen to spike and stocks to drop, perpetuating the cycle. On August 5th, the Nikkei 225 index dropped an eye-watering -12%, its largest single-day loss since Black Monday of 1987.
The panic spilled over into global markets, but was short-lived and investors’ nerves were calm by week’s end. However, there may be more to the story than the headlines suggested. While the Yen carry trade exacerbated the volatility, it probably was not the only cause.
The Bank of Japan had telegraphed tightening policy for many months, and the BOJ began raising interest rates in March. Markets and investors were well aware of the BOJ’s stance, yet global stocks continued to rally through July.
Yes, the BOJ was more hawkish than expected, however, it wasn’t until weakness in U.S. economic data also popped up that investors panicked. The weak U.S. numbers all but cemented a long-awaited rate cut by the Federal Reserve.
So, it seems the Fed cutting rates was as much of a sell-off catalyst as the BOJ raising. That sounds counter-intuitive because markets and investors had long awaited a Fed “pivot.” The consensus expectation was a Fed rate cut would induce a celebratory rally in risk assets as investors reminisce about the halcyon days of ZIRP when markets only went up.
The quick rebound suggests that will still happen. However, the adverse market reaction in August is a warning about something we have been wary about for the past year. In February I wrote investors were misplacing their hopes in a Fed rate cut.
Although a rate cut may sound good, the implications are typically more negative than positive. Simply put the Fed cuts rates when it sees or expects economic weakness. And on the flip side, the Fed raises rates when the economy is strong (to prevent overheating).
This is more than intuitive, economic history shows a consistent relationship between interest rates and business cycles. The chart below shows the Federal Funds Rate (blue line) and U.S. recessions (grey bars) since 1954.
Federal Funds Rate
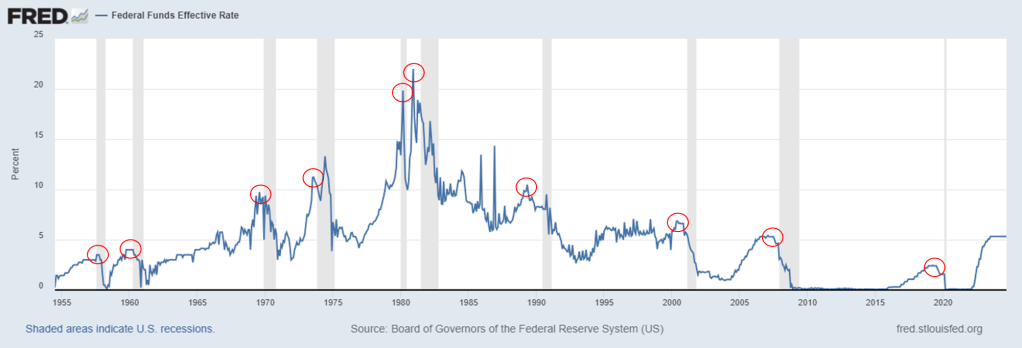
Notice the FFR peaked (red circles) before the start of every recession, except in 1957 when it peaked during the recession. Said another way, recessions typically don’t start until after the FFR peaks, and until after the Fed starts cutting. That puts the Fed’s much-hoped-for rate cuts in a more solemn perspective.
Beyond the speed and magnitude of Fed rate cuts, we pay attention to their impact on the Treasury yield curve because it is one of the most reliable leading economic indicators. An inversion of the TYC has preceded every U.S. recession in history and a reversion (or un-inversion) has preceded the last four.
Treasury Yield Curve

Despite the Fed cutting 50 bps in September, the U.S. 3-month to 10-year TYC remains inverted. However, some may not be aware that another part of the curve, namely the 2-year to 10-year segment, has already reverted. That’s another warning because the 2Y10Y curve tends to lead the 3M10Y. For example, the 2Y10Y led the 3M10Y into inversion in 2022.
Last quarter, we wrote that the TYC reverting would be an important signal to watch for and it appears that signal is playing out now. However important, the TYC is still only one indicator, and any single indicator could be wrong.
To improve the accuracy of signals, we want to observe uniformity and trends across multiple reliable, leading indicators. In addition to the TYC and interest rates, other indicators include (but are not limited to) corporate profits, employment, economically sensitive sector activity, and sentiment measures.
In aggregate, indicators are more mixed than last quarter but are still not trending clearly and uniformly. For example, the S&P Global U.S. Composite PMI indicator (for business activity and sentiment) registered 54.6 in August, the 10th consecutive reading above the crucial 50-level (indicating expansion).
U.S. Composite PMI

Employment conditions, on the other hand, look increasingly mixed. The jobs market looks strong on the surface as the unemployment rate remains near multi-decade lows. But a deeper look reveals some weakness. Private sector job creation (as measured by monthly Non-Farm Private Payrolls) shows a deteriorating trend.
Non-Farm Private Payrolls

While job creation is still positive, August marked the third consecutive month when it fell below what’s needed to keep pace with labor force growth (about ~200k per month). That echoes an emerging theme of uncertainty in economic data. Conditions are changing and searching for direction. We cannot predict how they will change, but we are watching closely and will follow their lead.
MARKET VIEW
Global stocks had several notable pullbacks in 2024, and the two most recent ones formed a double top in July and August (red line, below). A triple top was threatened in September. Had stocks failed to break out above resistance for a third time, that would have signaled a negative reversal in risk assets, especially given the Fed Rate cuts. Fortunately, that did not happen and the trend continues to be our friend for now (shown below as ACWI, the MSCI All Cap World Index).
ACWI 1-Year

Looking deeper provides more insight. First, the volume (blue bars above) on the breakout was subdued. Technically, we’d like to see more buyers participating to confirm the durability of a breakout. Second, current prices are above and outside where most trades were placed over the past year.
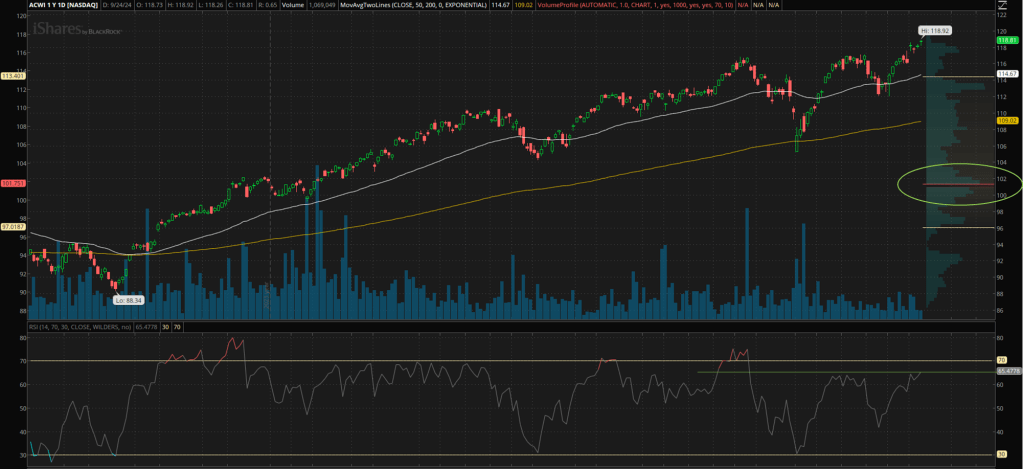
In the chart below, the red line (circled green) shows the “Point of Control,” (POC) or the price at which most trades were made in the past year. The yellow lines above and below the red POC line represent the “Value Range” (VR), or the price range where most volume was traded. The VR and POC are like centers of mass where prices tend to gravitate towards over time, all else equal.
ACWI 1-Year
While this may look alarming, it doesn’t necessarily mean that price must revert to the POC. The counter-argument would be that new highs often start above an existing VR and a new POC is formed over time instead of all at once. Again, this is why it helps to look at multiple indicators.
One more market indicator we can consider is momentum. In the chart above, the RSI (bottom panel) still faces resistance (green line) and has been unable to make new highs (relative to July). This reflects fading price momentum, which along with low volume, suggests this rally is losing steam, at least in the near term.
So, while the trend is positive, volume and momentum are fading. Overall, this suggests market conditions are vulnerable to negative shocks and we should expect at least a pullback or correction in the near term.
Of course, market movements are unpredictable, and pullbacks are normal, common, and not a reason for panic by themselves. What we should, and do, watch for is clear and uniform deterioration across both economic and market conditions. Fortunately, that is still not the case at present.
INVESTING VIEW
We maintained a neutral risk exposure in our Macro Allocation strategy through Q3 with all model portfolios at their strategic target risk weights. That kept returns in line with expectations and served us well because stocks and bonds ended the quarter positively.
In hindsight, going overweight in stocks may have yielded higher returns, but would also have resulted in higher volatility. We abstained from moving to an overweight risk position because we observed late-stage business cycle conditions (divergences noted above), volatile market conditions, and elevated equity market valuations. In short, conditions were not good enough to support overweight risk exposure, but not bad enough to warrant an underweight.
Meanwhile, we adjusted the non-risk asset, fixed-income side of MA portfolios. Specifically, we reduced our allocation to short-term fixed income (STFI) and increased our allocation to longer-duration Treasuries and investment-grade bonds. We did that in anticipation of imminent rate cuts, and it served us well because longer-duration bond prices rallied during the quarter.
As we enter Q4, we continue to watch for clear and uniform trends in the data before adjusting our risk exposures. The current divergences and rising volatility reflect uncertainty among investors and the markets, which is common during transitionary periods.
Although it is not a formal part of our investment process, we would be remiss to assume the upcoming U.S. presidential election does not matter. Of course, the policies of the next administration will matter to markets. For example, a change in tax rates, whether for corporate profits or capital gains, would result in a market-wide repricing of affected investments.
The problem with politics is that elections and policies are highly unpredictable. Even after votes are tallied, policies have a way of being dragged out and amended to the point of being meaningfully different from what was originally promised, feared, or hoped for. Suffice it to say that it would not be prudent to base investment decisions predominantly on what politicians promise.
Regardless of what does or does not happen, we will continue to carefully watch and patiently wait for changing conditions to justify a clear and present need to adjust our risk exposures. We’ll keep you updated on what we see and do along the way.
—
Victor K. Lai, CFA

You must be logged in to post a comment.