
I’ve been paying close attention to the US Treasury yield curve since last year because it is, historically, a reliable bellwether for economic conditions. After threatening an inversion for months, the 2-10 year curve finally did so in late March. The inversion was short-lived, however, lasting only days.
Figure 1: 2-10 Year Treasury Curve
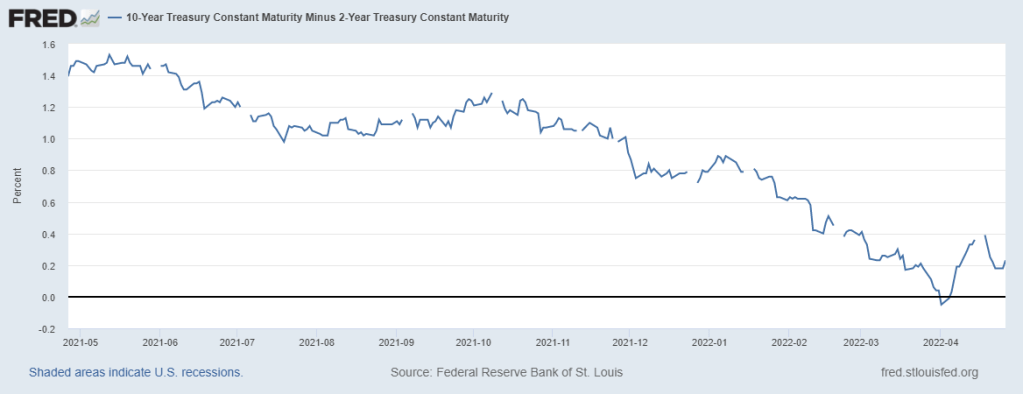
It seemed like investors around the world were holding their breaths in anticipation of inversion. And now that it’s happened we’re hearing a collective exhale of opinions and commentary on what it means. While inversions typically lead recessions many believe things will be different this time.
For example, the brevity of inversion has some arguing longer duration is needed for a meaningful signal. Others argue the 3mo-10yr curve remains steep, still has not inverted, and so recession risk is overblown. Last but not least some believe the Federal Reserve’s unprecedented QE (“quantitative easing” or manipulation) has impaired bond market signals.
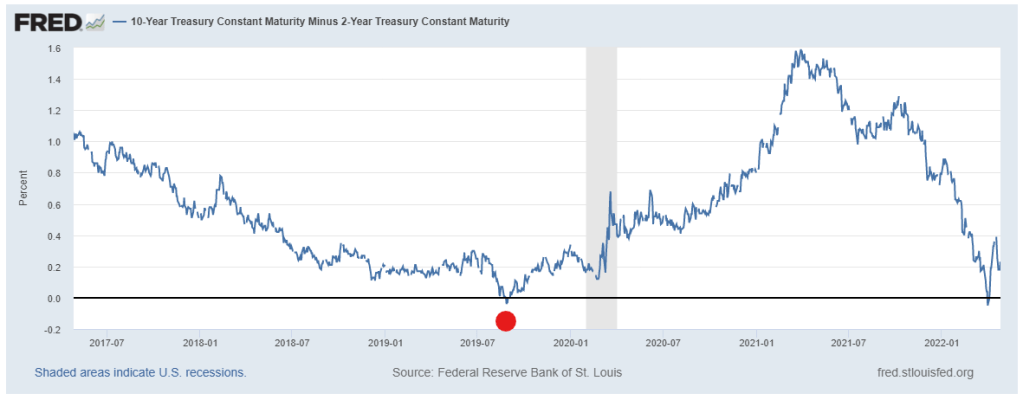
A yield curve inversion itself does not spell imminent recession. However, the “different this time” arguments are no more compelling. With respect to brevity, we only need to look back to 2019 (Figure 2) to see a similarly brief 2-10 year inversion (red dot) led the 2020 pandemic recession (grey bar).
Figure 2: 3mo-10yr Treasury Curve
It’s fair to argue the 2020 recession was unusual and the 2019 inversion had no relation to the pandemic that caused the recession. But that misses the point. An inversion does not predict the cause of a recession, it simply indicates economic conditions are vulnerable and at risk. The pandemic was the straw that broke the economy’s back in 2020, but it just as well could have been something else.
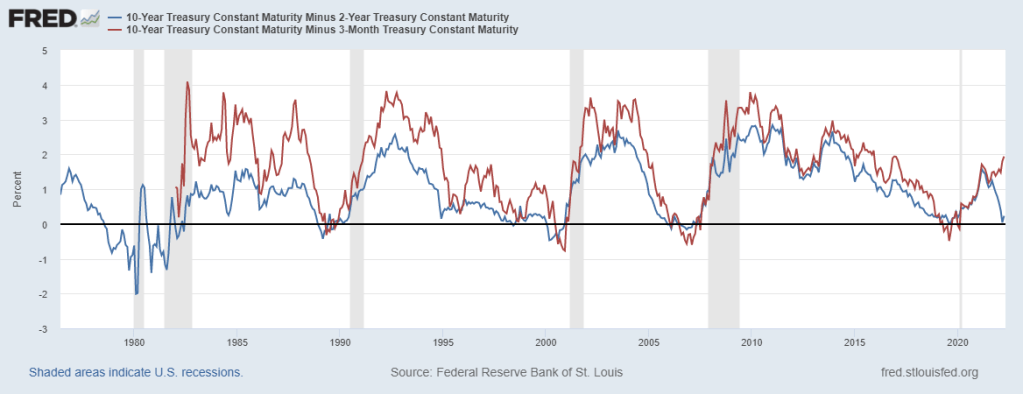
In terms of the 3mo-10yr curve (red line in Figure 3), it is true that it has steepened instead of inverted. However, it’s also worth noting the 2-10 year curve (in blue) historically leads the 3-10 curve. In other words, the 2-10 inverts before the 3-10 curve. As of now, we’re seeing a clear divergence between the two curves that will reverse one way or another.
Figure 3: Treasury Curve Divergence
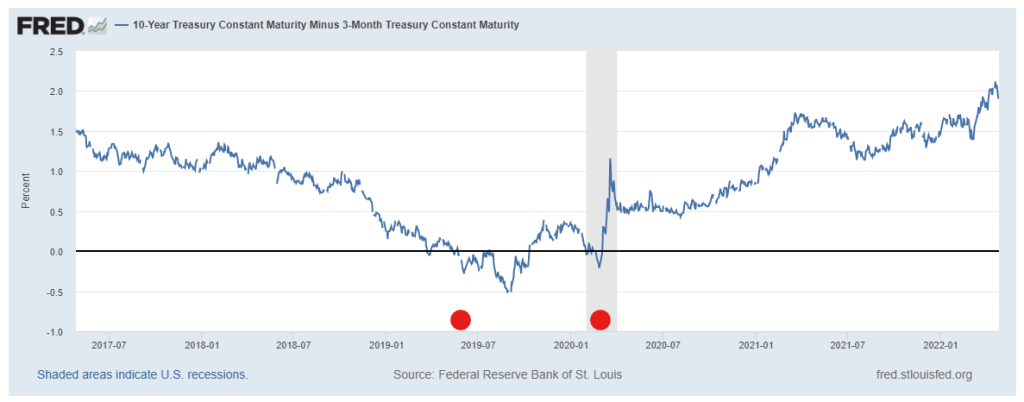
In addition, if we’re splitting hairs and straws about which inversions to count, then notice the 3-10 curve has technically already inverted. Figure 4 shows the 3-10 curve inverted in 2019 before the pandemic recession and then inverted again in 2020.
Figure 4: 3mo-10yr Treasury Curve
Last, the Fed’s unprecedented manipulation of bond markets is obviously affecting Treasury yields. The Fed’s substantial purchases of long-dated Treasury bonds through QE have kept long-term rates artificially low. Likewise, the unwinding of the Fed’s balance sheet may send long-term rates substantially higher as bonds flood the open market.
Figure 5: Fed Balance Sheet Assets
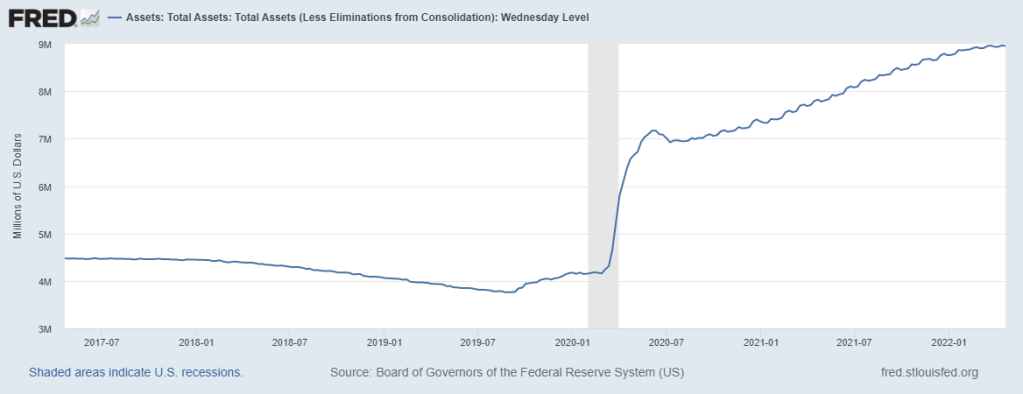
The argument is if it wasn’t for QE, the yield curve would be significantly steeper and the yield curve would not have inverted. That makes sense. But by the same reasoning, hasn’t the Fed also kept short-term rates artificially low with unprecedented ZIRP (zero interest rate policy)? Would Treasury curves be less steep (or even inverted) without that manipulation?
The argument goes both ways and also misses the point. Yes, the Fed can manipulate the bond market and temporarily affect yield outcomes. But ultimately, investors in aggregate determine where yields go and the slope of the curve. The Fed buying bonds to suppress long-term yields does not preclude investors from selling bonds to raise them. In that sense, yields are a reflection of investor and market sentiment.
Arguing over yield curve technicalities, precise timing, or which straw will break the economy’s back is like splitting hairs, not helpful. It’s more useful to simply recognize an inversion signals market sentiment and expectations have turned pessimistic.
That does not mean recession is imminent but it means economic conditions are vulnerable. It means that, if you haven’t already, it’s time to pay attention and proceed with caution.
—
Victor K. Lai, CFA

You must be logged in to post a comment.